According to crypto analyst Crypto Yoddha, Ethereum (ETH) may have finally reached its bottom. The analyst shared their insights on X, suggesting that the second-largest cryptocurrency by market cap could be on the verge of a trend reversal.
Is The Ethereum Bottom Finally In?
Crypto Yoddha shared a 10-day ETH chart indicating that the digital asset has likely bottomed for this cycle. To support this analysis, the analyst highlighted striking similarities between ETH’s current price behavior and its movement during the 2019–2020 cycle.

According to the analyst, Ethereum followed a similar price structure in its previous cycle before embarking on a bullish rally that surged 2,500%. The chart also suggests the completion of a WXY correction pattern from Elliott Wave Theory, a three-wave corrective structure that often precedes trend reversals.
For the uninitiated, The WXY corrective pattern in Elliott Wave Theory is a three-wave correction where W and Y are corrective moves, and X connects them. It’s a more complex version of an ABC correction, making price movements last longer before the trend continues.
The analyst further emphasized that breaking the $4,600 resistance level is crucial for ETH to sustain its bullish momentum. If ETH clears this hurdle, it could replicate its previous cycle’s trajectory, potentially rallying to $10,000–$13,000.
Crypto Yoddha’s sentiments were echoed by fellow crypto trader Mister Crypto. The analyst shared the following chart, saying that ETH has bottomed and a ‘big reversal’ is likely to happen soon.
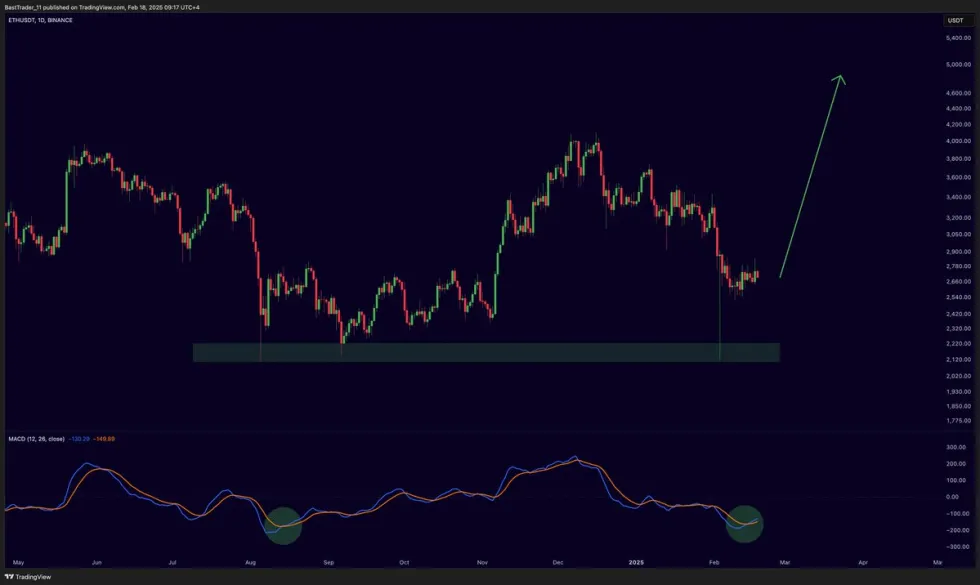
ETH Price Mirroring Its Previous Market Cycle
A group of seasoned crypto traders, Shuarix, also weighed in on ETH’s price behavior. They compared ETH’s current structure to its 2020 price action during the COVID-induced market crash.
According to Shuarix, ETH recently experienced a false breakout from a symmetrical triangle pattern, followed by a major pullback. They believe this setup could lead to a strong rally, as the market shakes out so-called “weak hands.”
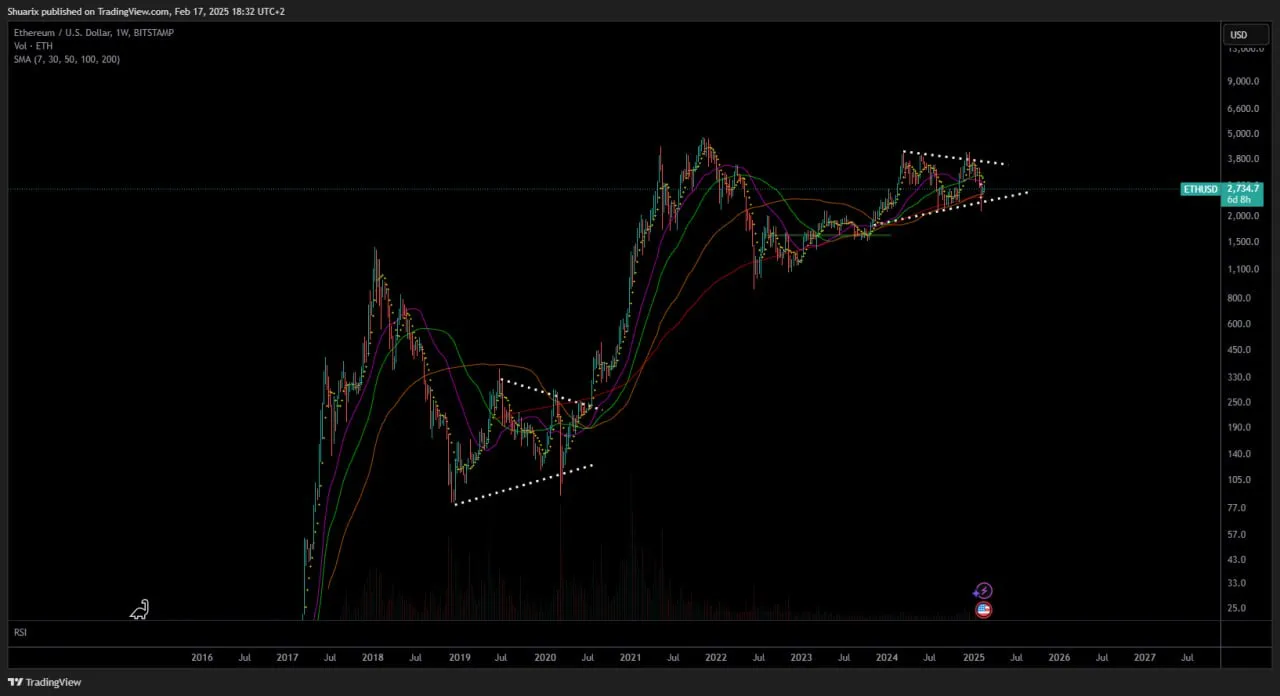
They added that bearish sentiment surrounding ETH currently is at a level not seen since the year 2020. Indeed, on-chain data reveals that so-called ‘ETH whales’ – wallets with substantial ETH holdings – are starting to lose faith in the digital asset.
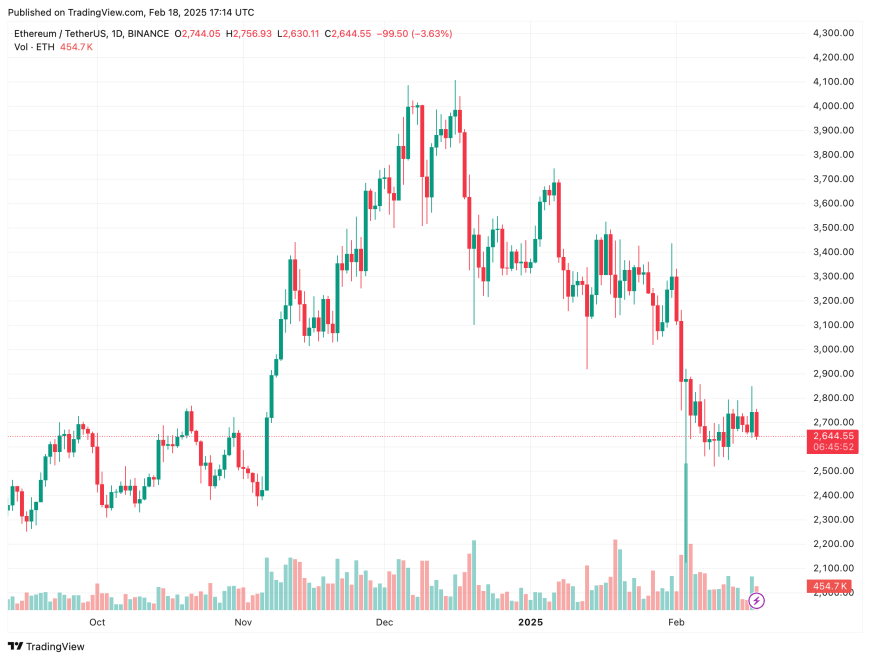
Besides the large investors showing diminishing trust in ETH, the Ethereum staking percentage has also crashed from the highs of November 2024. At press time, ETH trades at $2,644, down 3.5% in the past 24 hours.
Featured Image from Unsplash.com, charts from X and TradingView.com