Ethereum price is still struggling to clear the $4,000 resistance zone. ETH might consolidate for some time above $3,600 before the bulls gain strength.
- Ethereum traded to a new multi-month high above $3,980.
- The price is trading near $3,850 and the 100-hourly Simple Moving Average.
- There is a short-term breakout pattern forming with resistance at $3,950 on the hourly chart of ETH/USD (data feed via Kraken).
- The pair could resume its increase if it clears the $3,950 resistance zone.
Ethereum Price Revisits $4K
Ethereum price extended its rally above the $3,900 level, like Bitcoin. ETH cleared the $3,950 level and traded close to the $4,000 resistance zone. It traded to a new multi-month high above $3,990 and recently started a consolidation phase.
There was a pullback below the $3,920 level. The price tested the 23.6% Fib retracement level of the recent wave from the $3,211 swing low to the $3,9983 high. Ethereum price is now consolidating near $3,850 and the 100-hourly Simple Moving Average.
There is also a short-term breakout pattern forming with resistance at $3,950 on the hourly chart of ETH/USD. If the pair stays above the $3,800 level, it could attempt another increase. Immediate resistance on the upside is near the $3,900 level.
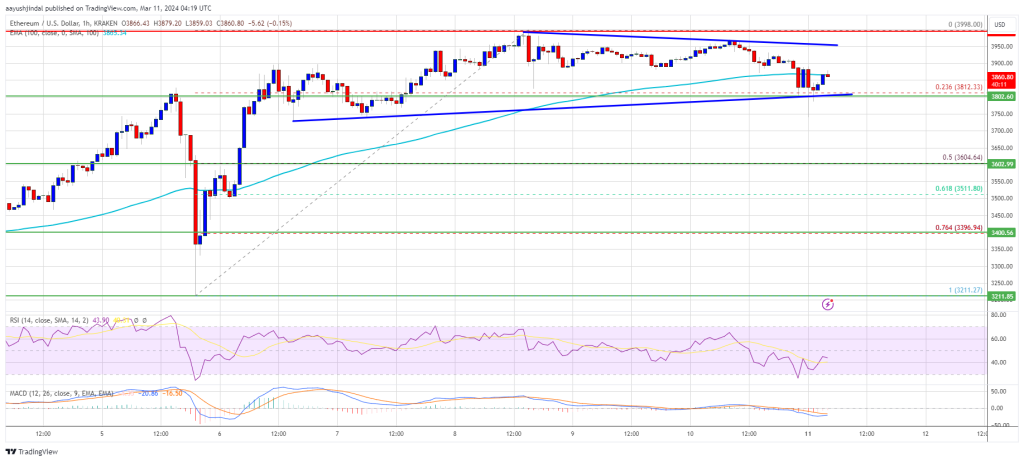
Source: ETHUSD on TradingView.com
The first major resistance is near the $3,940 level. The next major resistance is near $4,000, above which the price might gain bullish momentum. In the stated case, Ether could rally toward the $4,120 level. If there is a move above the $4,120 resistance, Ethereum could even rise toward the $4,220 resistance. Any more gains might call for a test of $4,350.
Are Dips Limited In ETH?
If Ethereum fails to clear the $3,950 resistance, it could start another downside correction. Initial support on the downside is near the $3,800 level.
The first major support is near the $3,600 zone or the 50% Fib retracement level of the recent wave from the $3,211 swing low to the $3,9983 high. The next key support could be the $3,400 zone. A clear move below the $3,400 support might send the price toward $3,250. Any more losses might send the price toward the $3,120 level.
Technical Indicators
Hourly MACD – The MACD for ETH/USD is losing momentum in the bullish zone.
Hourly RSI – The RSI for ETH/USD is now below the 50 level.
Major Support Level – $3,800
Major Resistance Level – $3,950
Disclaimer: The article is provided for educational purposes only. It does not represent the opinions of NewsBTC on whether to buy, sell or hold any investments and naturally investing carries risks. You are advised to conduct your own research before making any investment decisions. Use information provided on this website entirely at your own risk.