A bullish divergence may be forming for both Bitcoin and Ethereum if the data of this on-chain indicator is anything to go by.
Bitcoin & Ethereum Net Realized Profit/Loss Has Turned Negative Recently
According to data from the on-chain analytics firm Santiment, the average trader is moving their BTC and ETH at a slight loss right now. The relevant indicator here is the “Net Realized Profit/Loss” (NRPL), which keeps track of the net amount of profit or loss that the investors are realizing through their selling currently.
This indicator works by going through the blockchain history of each coin being sold to see what price it was last moved at. If this previous selling price for any coin was less than the current spot price (that it is now being sold at), then that particular coin’s sale is realizing a profit.
Similarly, in the opposite case, the investor would be harvesting losses with the coin’s movement. As such, the NRPL adds up all such profits and losses and takes their difference.
When the metric’s value is positive, it means that the market as a whole is realizing a net amount of profit currently. On the other hand, negative values suggest the average trader is selling at some loss.
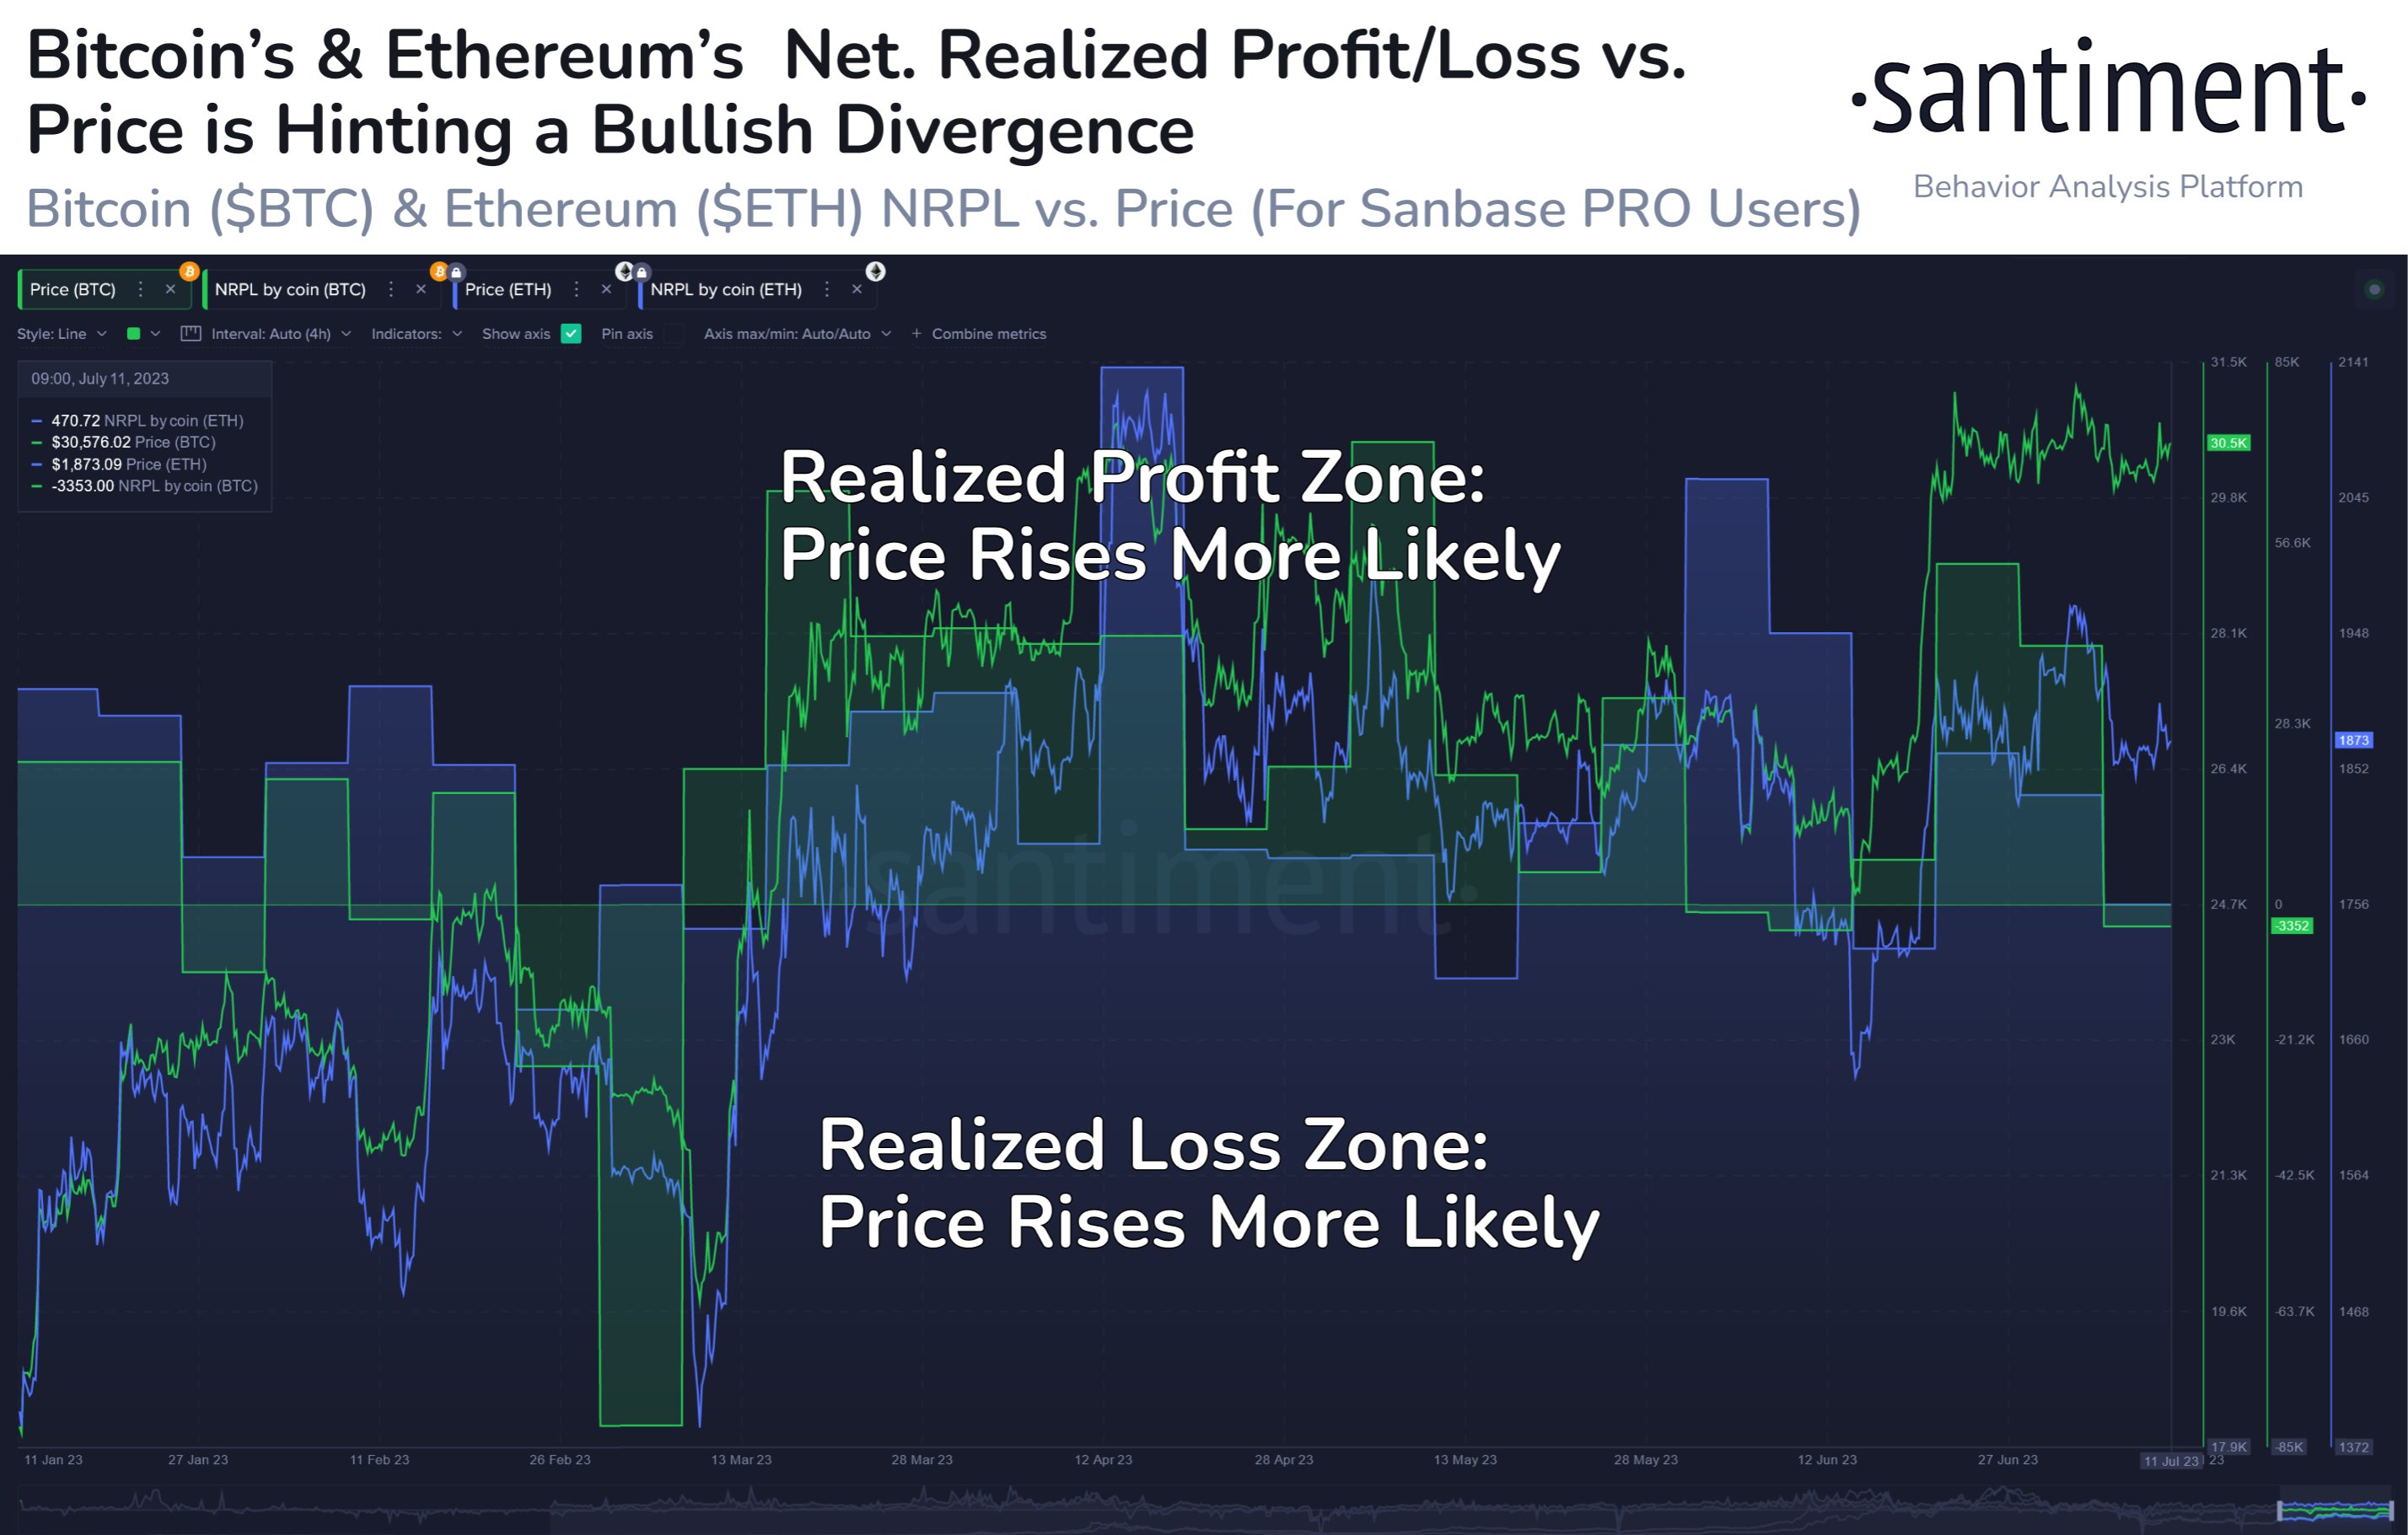
Now, here is a chart that shows the trend in the NRPL for both Bitcoin and Ethereum over the last few months:
The value of the metric seems to have been become negative for both the cryptocurrencies | Source: Santiment on Twitter
As displayed in the above graph, the NRPL has turned negative for both Bitcoin and Ethereum recently. This means that the investors of the two largest cryptocurrencies in the sector have been selling their coins at a loss on average in this period.
These losses have only been slight, though, as both of these assets haven’t moved too significantly in this period. Generally, deep capitulation events where holders exit the market at large losses only occur when the price observes an extended drawdown.
Historically, whenever the indicator has entered into the loss territory, the probability of a price jump has gone up. This is because loss selling can be a sign of weak hands leaving the market and investors with a stronger conviction may be picking up the coins they are selling.
Santiment notes that the current trend of the NRPL for these assets is forming a bullish divergence when compared to the prices. And naturally, this could lead to a rise in the prices of these coins.
However, as mentioned before, since the loss-taking is only at a slight level currently, the likelihood of a price increase is also obviously not too high, although it’s still a positive sign for Bitcoin and Ethereum nonetheless.
An example of this pattern potentially influencing the price may be seen right before the BTC rally above the $30,000 mark, where investors were selling at loss levels similar to now.
BTC Price
At the time of writing, Bitcoin is trading around $30,700, up 1% in the last week.
BTC continues to consolidate sideways | Source: BTCUSD on TradingView
Featured image from Pierre Borthiry – Peiobty on Unsplash.com, charts from TradingView.com, Santiment.net


