Picking the best crypto indicators can significantly improve your trading success by revealing hidden market trends, crucial support and resistance zones, and possible shifts in momentum. Whether you’re a beginner testing your first strategy or a seasoned trader refining advanced techniques, knowing the fundamentals of technical analysis is an essential step. Unlike fundamental analysis, which digs into a crypto’s underlying project or tokenomics, technical analysis focuses on historical price data, trading volume, and chart patterns.
This approach is especially useful in the crypto market, known for dramatic price fluctuations and unprecedented volatility. The following guide showcases several high-impact indicators—both simple and complex—and offers a foundation on how to integrate them into a profitable, adaptable trading strategy. By monitoring indicators tailored to price movements you can create more informed trading decisions regarding the best times to enter or exit a position. Let’s get into it.
What is Technical Analysis?
Technical analysis focuses on assessing specific historical data, like trading volume or price movements, to better predict upcoming price movements. By interpreting recurring patterns in candlestick charts, trend lines, and various oscillators, traders gain a clearer view of market momentum or potential reversals.
Unlike fundamental analysis, which examines a crypto project’s core technology or partnerships, technical analysis primarily hones in on chart patterns and statistical metrics. Traders will frequently combine multiple indicators to refine their strategies, mitigate false signals, and adapt to market volatility.
For instance, a moving average might highlight a trend’s direction, while an oscillator like the relative strength index (RSI) can help highlight overbought or oversold conditions. But when combined, these tools are capable of cutting through the market noise so you can make more objective, timely decisions. That said, no chart or formula can completely eliminate risk, and every single trade will still require thoughtful risk management and personal discipline.
Types of Indicators for Crypto Trading
Now we’re going to take a look at a wide range of technical indicators and chart concepts crucial for spotting price movements, gauging market momentum, and planning a well-rounded trading strategy. Each tool helps you interpret historical price data differently, so combining several indicators can reduce false signals and refine entries or exits.
1. Line Charts
A line chart displays a crypto’s closing price over time, forming a continuous line that helps visualize the overall trend. Because it only tracks one data point (typically the close price), it offers a clear, uncluttered view of market direction. Traders often start with line charts to identify broad trends before diving deeper.
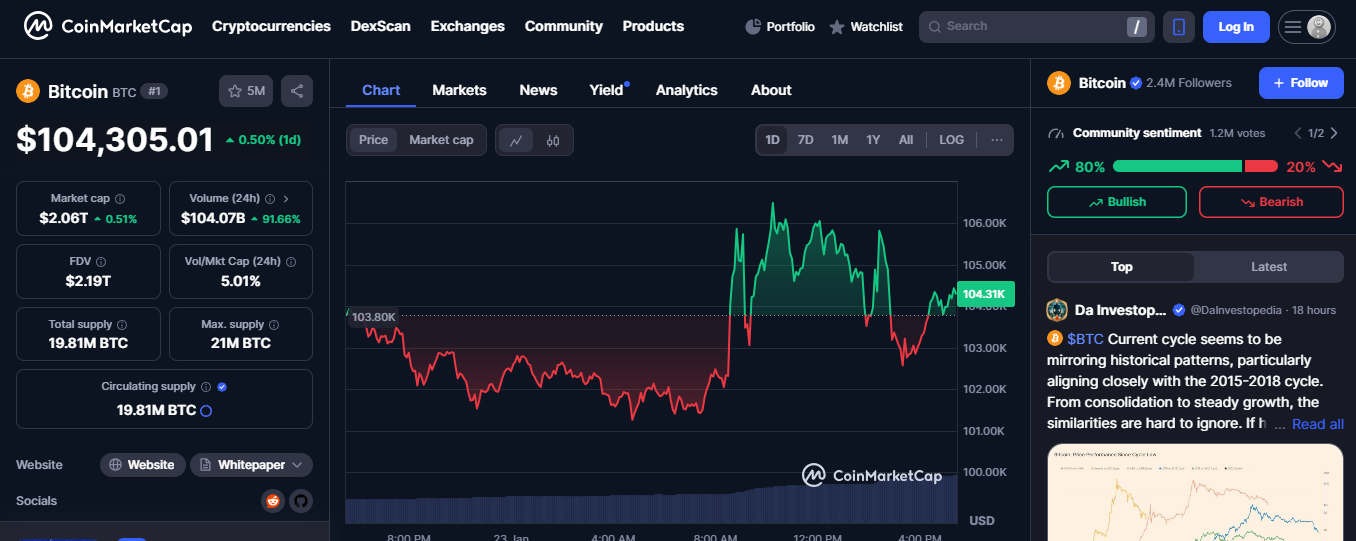
Source: CoinMarketCap
2. Bar Charts
:max_bytes(150000):strip_icc():format(webp)/BTCBarChart-47451c53e9e746958f52c9dac2e4d07a.jpg)
Source: TradingView
Bar charts expand on line charts by showing each period’s open, high, low, and close (OHLC). Each bar represents a time interval, displaying intraday fluctuations more precisely. The left tick marks the open price, while the right tick shows the close. By seeing highs and lows, you can gauge buying and selling pressure more accurately.
3. Candlestick Charts
Candlestick charts provide a visual snapshot of open, high, low, and closing prices, but with color-coded “candles” reflecting bullish or bearish movement. Green or white candles indicate a higher close vs. open, while red or black show a drop. Candlesticks spotlight patterns that can reveal potential trend reversals or market sentiment shifts.
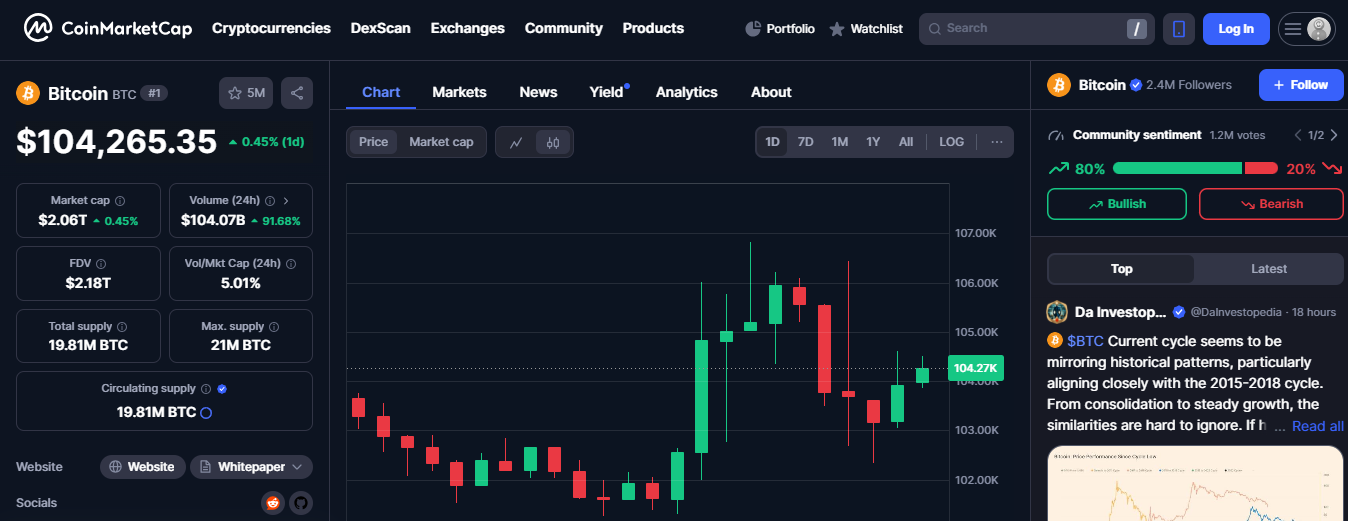
Source: CoinMarketCap
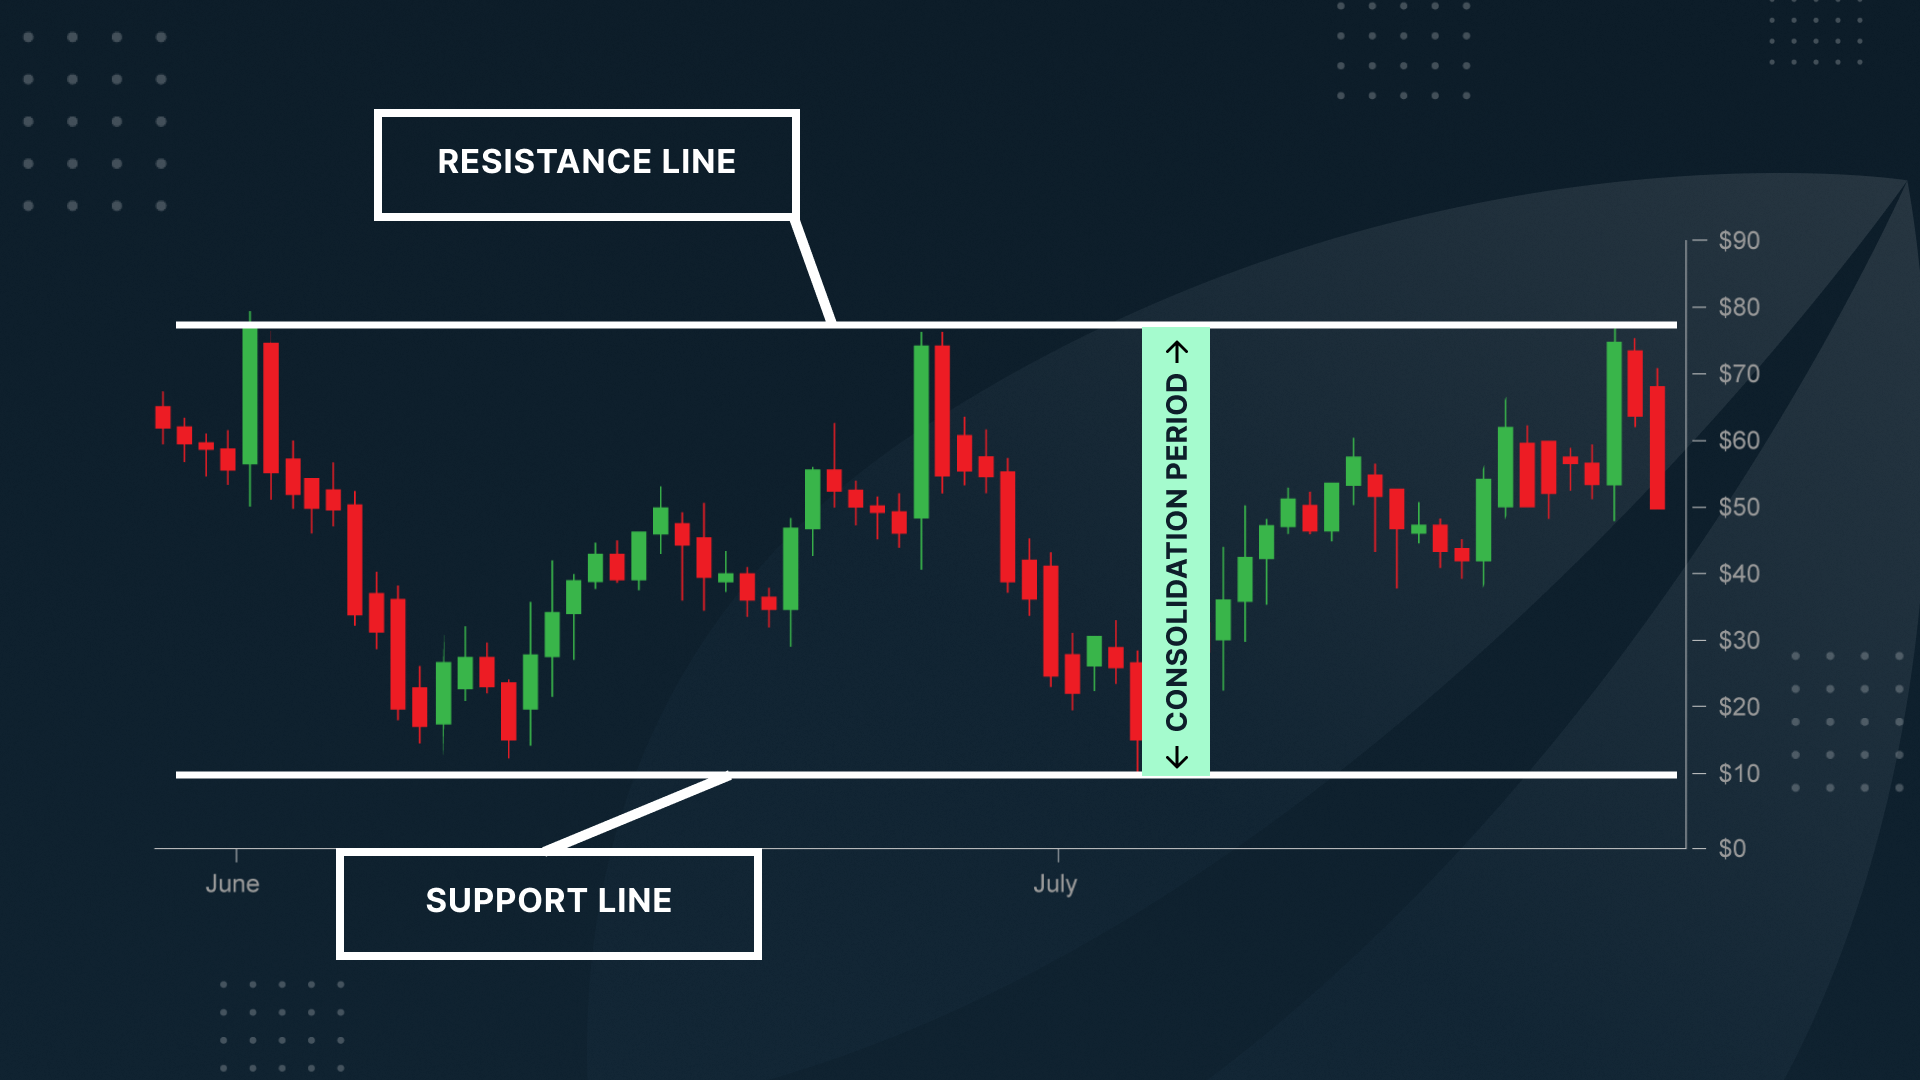
4. Support levels
Support levels are price points where downward trends often pause or bounce upward. They form when buying interest overpowers selling pressure at specific price zones. Traders watch support for potential low-risk entry points, placing stop-loss orders just below in case the asset breaks lower. Failing to hold support may suggest a further decline.
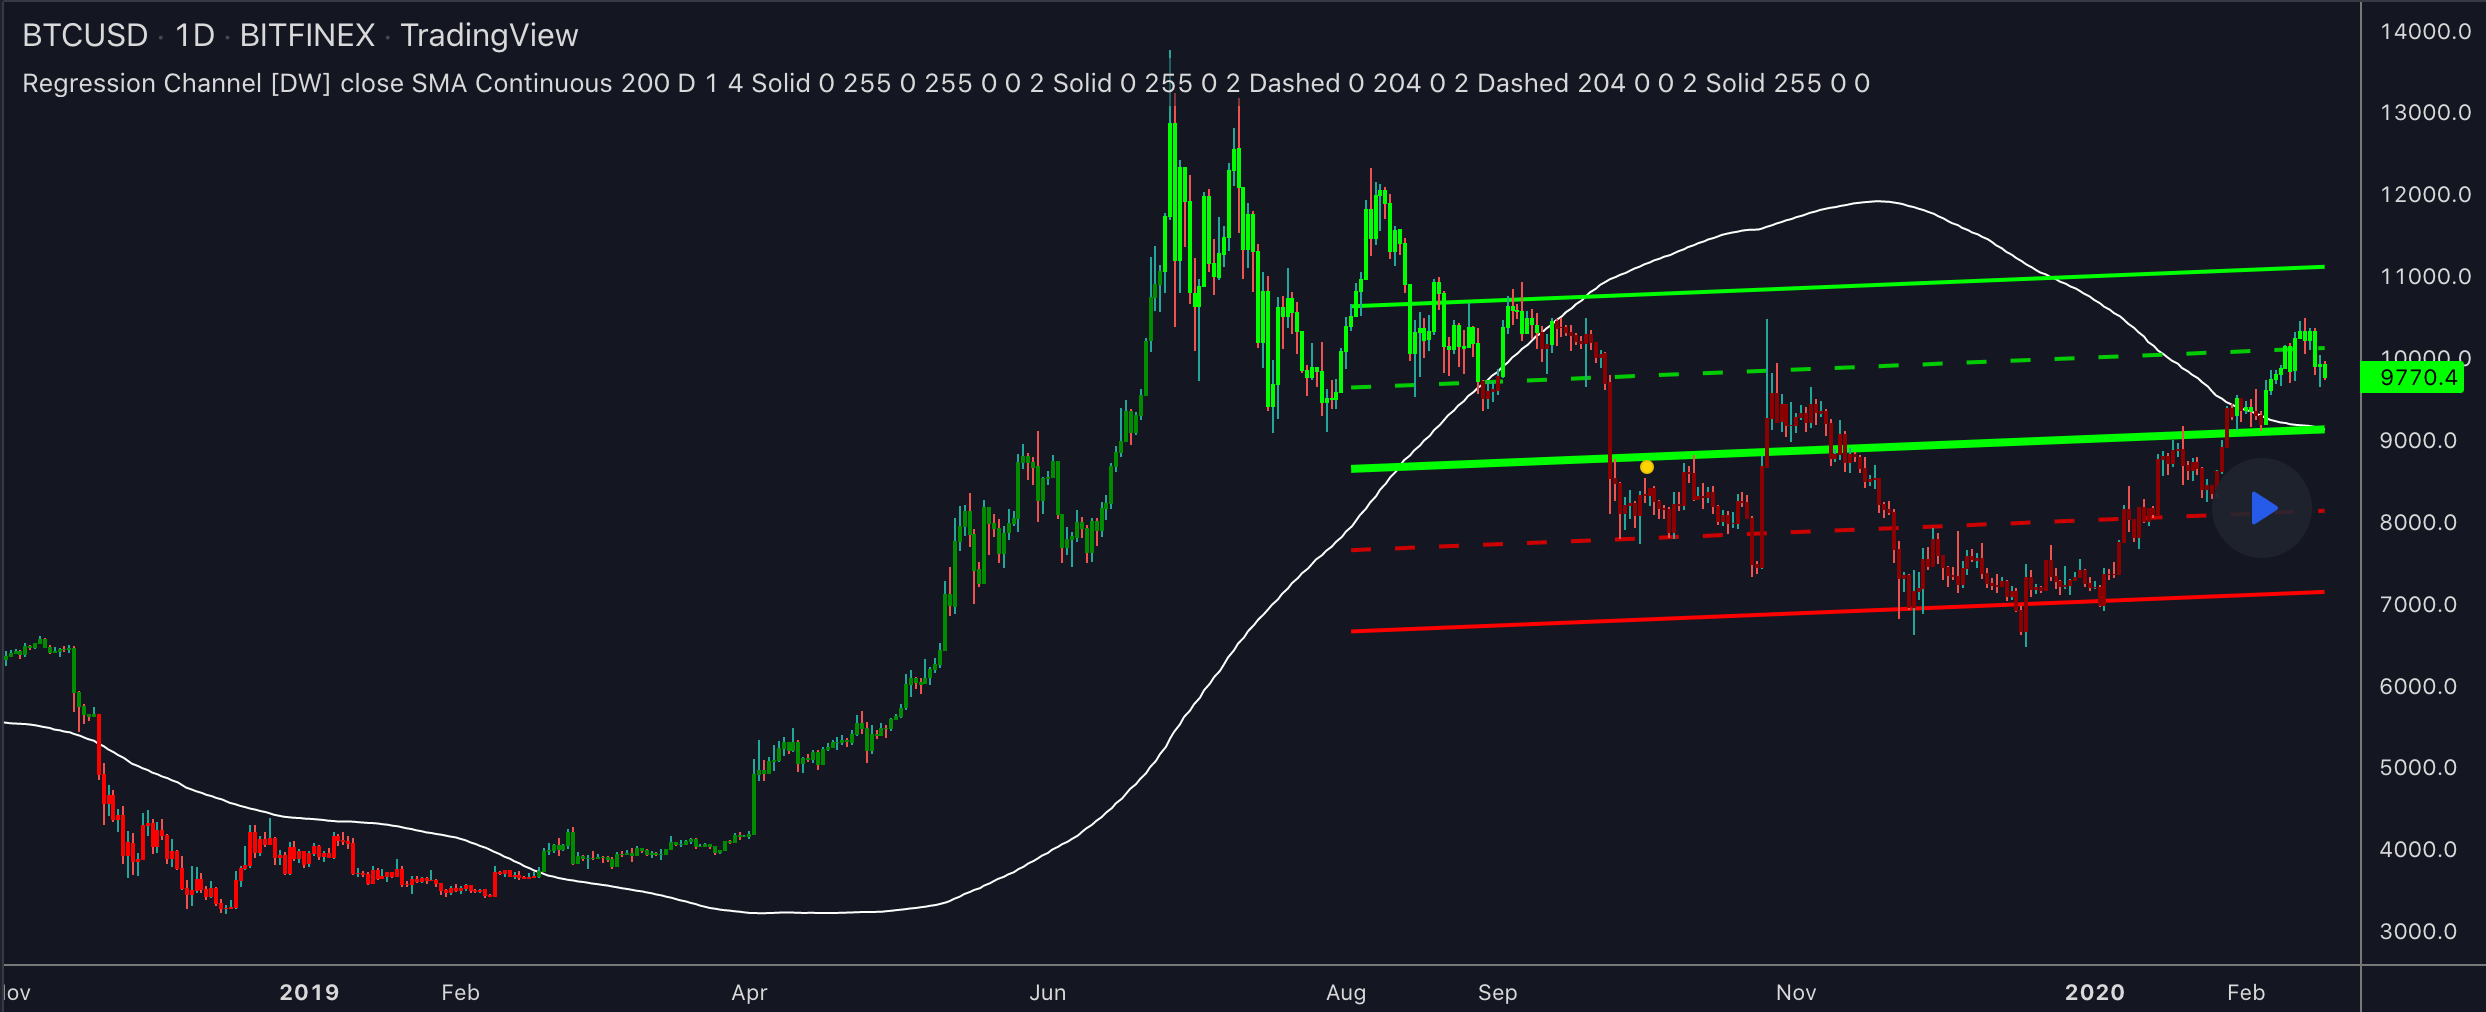
:max_bytes(150000):strip_icc():format(webp)/BTCSupportandResistance-a7002ab381634b48b1848e1ece7a9993.jpg)
Source: TradingView
5. Resistance levels
Resistance is the opposite of support. Frequently prices will stall or reverse downward when they reach a major resistance line. Sellers tend to dominate at these levels, hindering the asset from moving higher. Once the price breaches strong resistance and holds above it, that zone can become a new support area, indicating potential bullish momentum.
6. Upward Trends
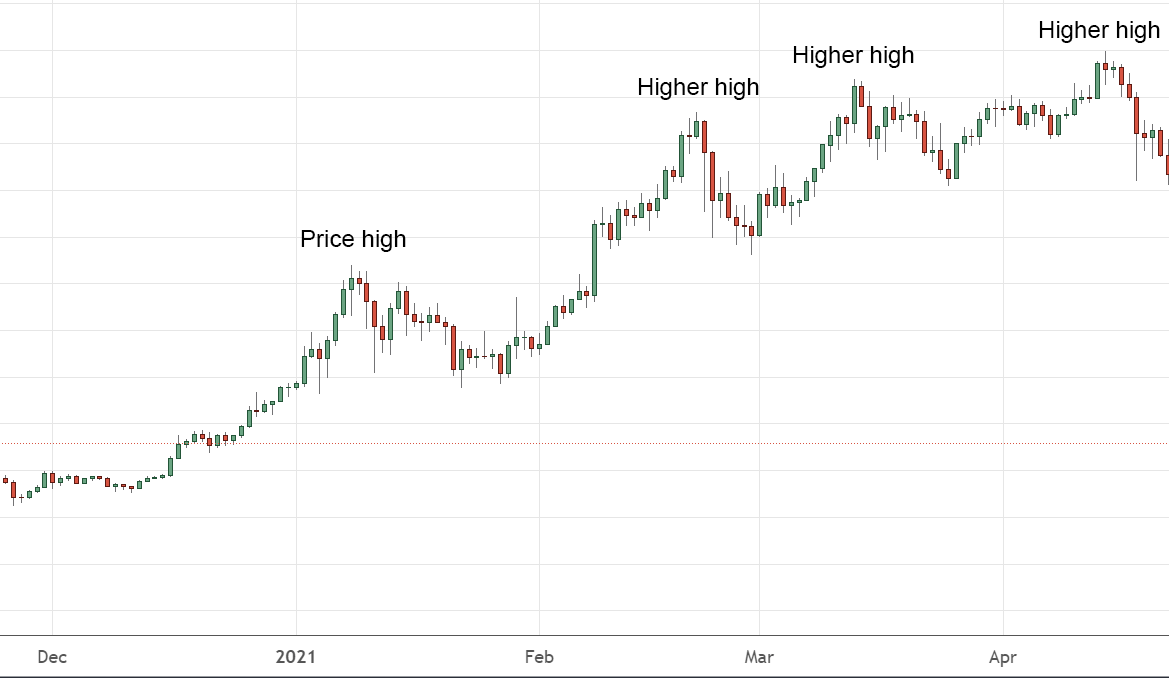
Source: Swyftx Learn
An upward trend is characterized by higher highs and higher lows, indicating strong buying activity. Traders may follow this trend until it visibly breaks support or forms a reversal pattern. In a sustained bullish market, you can use additional indicators, like moving averages, to validate momentum and attempt to ride the trend profitably.
7. Downward Trends
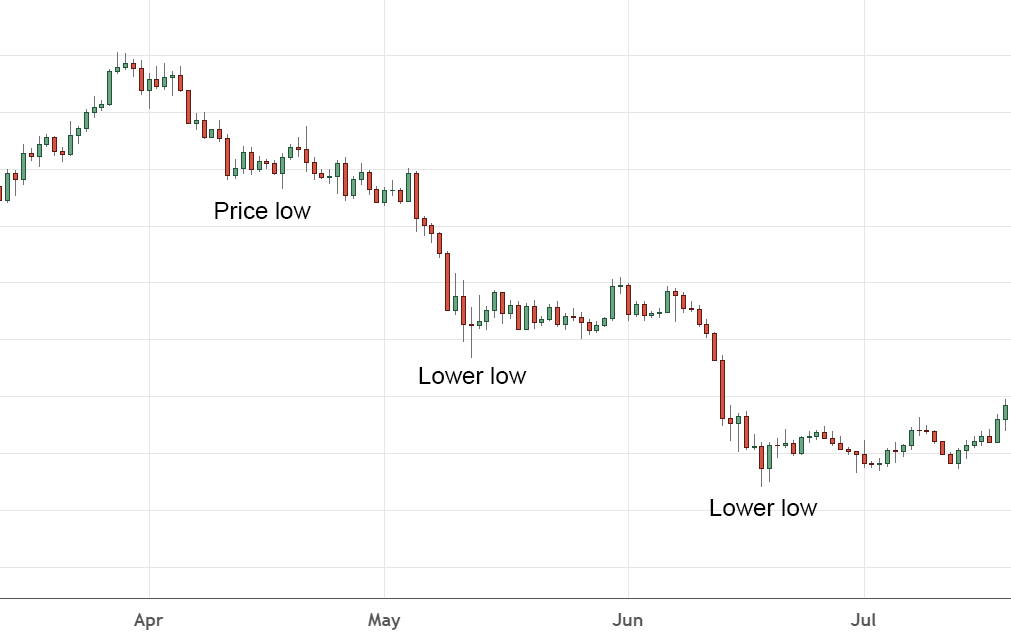
Source: Swyftx Learn
A downward trend shows lower highs and lower lows, signifying consistent selling pressure. As prices continually fall, watch for breakouts above key resistance levels to confirm a potential reversal. Many traders short-sell or avoid buying in a downtrend, waiting for a significant break of the descending line or a confirmed bottom formation.
8. Consolidation Trends
Source: Cryptohopper
Consolidation, or sideways movement, happens when the market has low volatility and the price moves within a tight range. This phase often precedes more dramatic moves, with the breakout direction setting the stage for future price action. During consolidation, some traders scale back, while others anticipate entry points near key support/resistance.
9. Moving Average Convergence Divergence (MACD)

Source: TradingView
MACD uses two exponential moving averages, the signal line and the MACD line, in conjunction with a histogram that shows the gap between them. When the MACD crosses above the signal line, it signals potential bullish momentum; a drop below might imply a bearish turn. MACD helps identify changes in trend strength and direction.
10. Moving Averages (MAs)
Moving averages smooth out price data, revealing the underlying trend. Simple moving averages (SMAs) weigh all data equally, while exponential moving averages (EMAs) give recent prices more emphasis. MA crossovers, like a shorter MA crossing above a longer one, will often precede changes in market momentum and can be a powerful market momentum indicator.
11. Average Directional Index

Source: TradingView
The average directional index (ADX), measures the intensity of a trend from 1 to 100. Values below 20 signal a weak or sideways market, while readings over 40 often mean a solid trend, either bullish or bearish. Traders sometimes pair ADX with other indicators to confirm that the market is truly trending, not whipsawing.
12. Relative Strength Index (RSI)

Source: TradingView
The RSI ranges between 0 and 100, highlighting overbought and oversold conditions. A reading above 70 may indicate overbought territory, which means a dip could be on the way, while an RSI under 30 suggests oversold levels, hinting at a possible bounce. This momentum oscillator can help traders decide when to enter or exit positions to avoid chasing extremes.
13. Bollinger Bands

Source: TradingView
Bollinger Bands envelop a moving average with two standard deviation lines above and below it. When the bands widen, market volatility is high; when they contract, volatility drops. Prices that break above or below the bands occasionally signal overextended conditions or emerging trends, aiding in spotting potential reversal zones.
14. On-Balance-Volume (OBV)
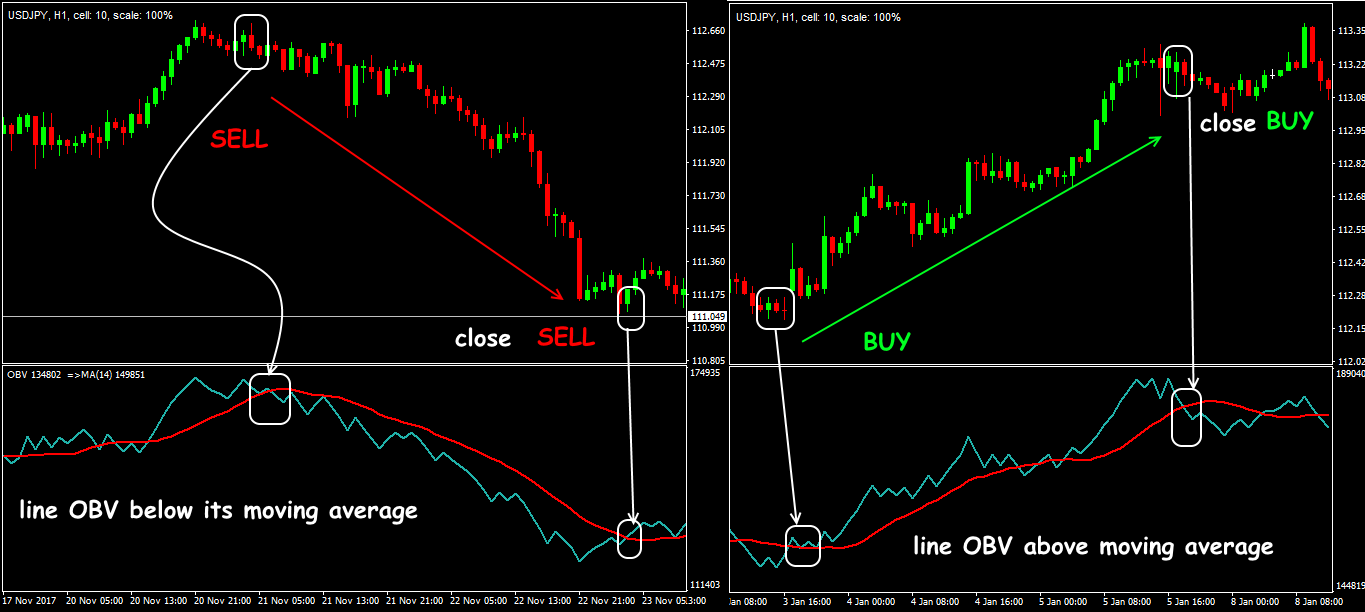
OBV connects trading volume with price direction to assess whether buying or selling pressure dominates. If the price forms higher highs while OBV moves lower, it might indicate weakening momentum, which can be a huge red flag for some traders. On the other hand, surging OBV can confirm an ongoing rally, signaling that volume backs the current trend.
15. Awesome Oscillator

Source: TradingView
Developed by Bill Williams, the Awesome Oscillator contrasts short-term and long-term price momentum. Plotted as a histogram around a zero line, positive bars imply bullish momentum, whereas negative ones suggest selling strength. Traders watch for the “twin peaks” or “zero line crossover” signals to anticipate possible trend reversals or continuations.
16. Fibonacci Pivot Points

Source: TradingView
These pivot points apply Fibonacci retracement levels to typical pivot-level calculations, providing potential support and resistance levels. Some traders prefer them to standard pivots, believing Fibonacci ratios can map out more precise reversal zones. In crypto, where market sentiment can shift abruptly, these levels serve as objective reference points for entries/exits.
17. Parabolic SAR

Source: TradingView
Short for “stop and reverse,” Parabolic SAR spots a trailing indicator that hovers below bullish price action and above bearish movement. When the indicator flips position, it may signal a potential trend reversal. Traders often combine Parabolic SAR with other momentum-based tools to distinguish genuine signals from routine pullbacks or rallies.
Where to Find Crypto Charts?
TradingView
TradingView stands out as a comprehensive charting solution, offering a vast range of technical indicators from basic moving averages to custom-coded oscillators built by its thriving community. It’s commonly used by crypto traders, but the same interface applies seamlessly to stocks, commodities, or forex.

Source: TradingView
The highly interactive nature of the platform fosters collective learning and improvement by letting you share the charts, scripts, and strategies of others. For those dealing with multiple crypto pairs, TradingView’s multi-chart setup can save time and improve research depth, enabling you to track global market trends in one streamlined dashboard.
CoinMarketCap
While not as sophisticated as TradingView, CoinMarketCap remains a go-to site for quick data on market capitalization, price fluctuations, trading volume, and overall market ranking. Its charting function is basic yet sufficient for top-level analysis, letting you spot multi-day or multi-month trends at a glance. Users can easily compare different tokens, manage a watchlist, and explore relevant links.
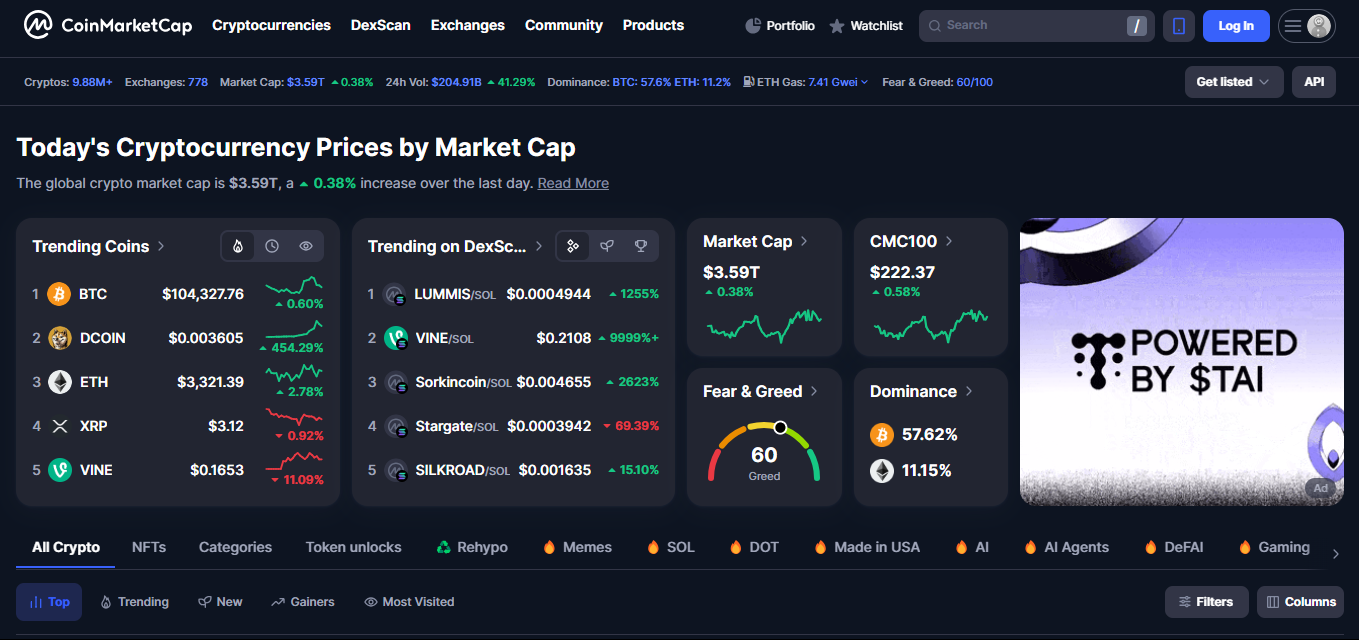
Source: CoinMarketCap
Though advanced traders may look elsewhere for deeper chart overlays, CoinMarketCap’s streamlined interface suits those who need immediate reference points or want to check broader crypto performance.
How to trade crypto with a technical indicator
Trading with indicators involves more than simply spotting a crossover or an overbought reading. You should combine at least one trend indicator with a momentum or volume-based tool to validate signals.
For instance, if your MACD line crosses above its signal line in a market that is making higher highs, this combination offers added confidence in a bullish move. Always take into account your risk tolerance when sizing positions, and be ready for false signals in a highly volatile environment.
Setting protective stop-loss orders is another vital step. You might place a stop just below a confirmed support level in case price action reverses.
Monitoring fundamental developments and market sentiment helps you avoid solely relying on charts. A sudden regulatory announcement or surprise listing can quickly nullify an indicator-based entry.
Adjust your strategies according to the crypto’s liquidity, as smaller tokens may be prone to whipsaw price shifts. Finally, review each trade after it closes. Keep notes on why you entered and how the indicator performed.
Over time, you can refine your approach to adapt to changing market conditions and avoid repeating mistakes.
Conclusion
Each of these indicators can offer valuable insights into ongoing price action, but no single tool guarantees consistent gains. The crypto market remains a fast-moving space with significant swings. Combining multiple indicators and verifying them with fundamental observations often yields more balanced decisions.
You should also stay up to date on macro developments and be mindful of your own trading psychology. By approaching crypto with the right mix of technical research, strategy, and discipline, you can better prepare yourself for both opportunities and potential pitfalls.
FAQs
What is the best indicator for cryptocurrency?
No single indicator excels for all scenarios. Many traders favor combinations like moving averages for spotting trends and RSI for momentum. This layered approach often lowers the chance of misleading signals.
What is the most accurate crypto predictor?
Accuracy depends on market conditions, volatility, and trader skill. Some rely on MACD or Bollinger Bands for dynamic feedback. Others mix multiple indicators with broader research to increase reliability.
Do crypto indicators work?
Indicators can help make structured decisions, but they are not foolproof. Market sentiment and external factors can override technical patterns. Combining several tools and adjusting for new events is generally the best approach.