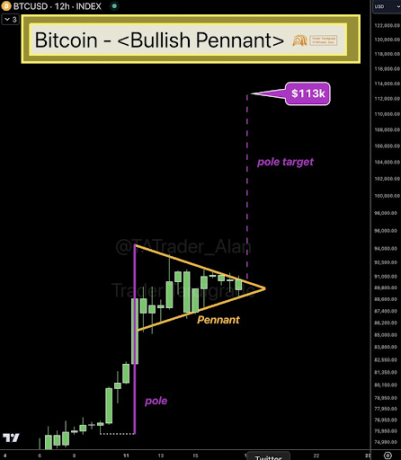
Crypto analyst Trader Tardigrade has revealed a bullish pattern that has formed on the Bitcoin chart. Based on this, the analyst explained how the Bitcoin price could rally to as high as $113,000.
Bitcoin Bullish Pennant Could Send Price To $113,000
In an X post, Trader Tardigrade mentioned a bullish pennant that had formed on the Bitcoin chart. The analyst remarked that the BTC price is still preparing for the next pump with this bullish pattern. A bullish pennant indicates the continuation of an uptrend following a brief consolidation period.
Related Reading

Trader Tardigrade said that the Bitcoin consolidation within the Pennant looks really healthy and good. He added that the Bitcoin price is climbing to the apex now and will make a breakout soon enough. In line with this, the analyst stated that the short-term target for the Bitcoin price remains $113,000.
In a more recent X post, Trader Tardigrade noted that BTC closed its weekly candle close to its current all-time high (ATH) at $93,000. The analyst stated this is a significant sign, confirming the breakout candles from long-consolidating ranges. He added that he has noticed that the strength of the uptrend isn’t decreasing, which confirms that this is the beginning of the bull run.
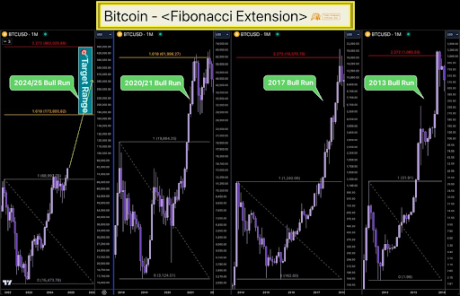
Based on historical trends, the analyst recently predicted that the Bitcoin price could rise to as high as $462,000 in this market cycle. He explained that massive bull runs have ended between Fibonacci extensions 1.618 and 2.272. Therefore, BTC could reach $173,000 at Fib extension 1.618 and rally to $462,000 if it reaches Fib extension 2.272.

BTC Could Witness A Significant Price Correction First
In an X post, crypto analyst Ali Martinez outlined several reasons why Bitcoin could be about to suffer a steep correction. Firstly, he stated that crypto enthusiasts are feeling extremely greedy at the moment. This greed is said to have spilled over retail investors as there has been a significant spike in Google search interest for Bitcoin.
Related Reading
Secondly, the analyst mentioned that BTC investors have realized over $5.42 in profits, which puts the Bitcoin price at risk of facing significant selling pressure if these investors decide to secure some of these profits now. From a technical perspective, Martinez also noted that the TD Sequential has presented a sell signal on the BTC daily chart.
Meanwhile, the Relative Strength Index (RSI) signals that Bitcoin is currently overbought. If this BTC price correction happens, Martinez stated that the key support walls to watch are between $83,250 and $85,800 and between $72,880 and $75,520. However, the analyst added that a sustained daily close above $91,900 would invalidate this bearish Bitcoin outlook and would trigger a breakout to $100,680.
Featured image created with Dall.E, chart from Tradingview.com


