Bitcoin is trading around $75,000 following Donald Trump’s victory in the U.S. election, stirring fresh optimism in the crypto market. Trump’s pro-crypto stance has ignited excitement among analysts and investors who anticipate favorable policies for digital assets in his administration. With Bitcoin now sitting at all-time highs, many speculate this could begin a new rally phase.
Related Reading: Ethereum Analyst Sets $3,400 Target Once ETH Breaks Key Resistance – Details
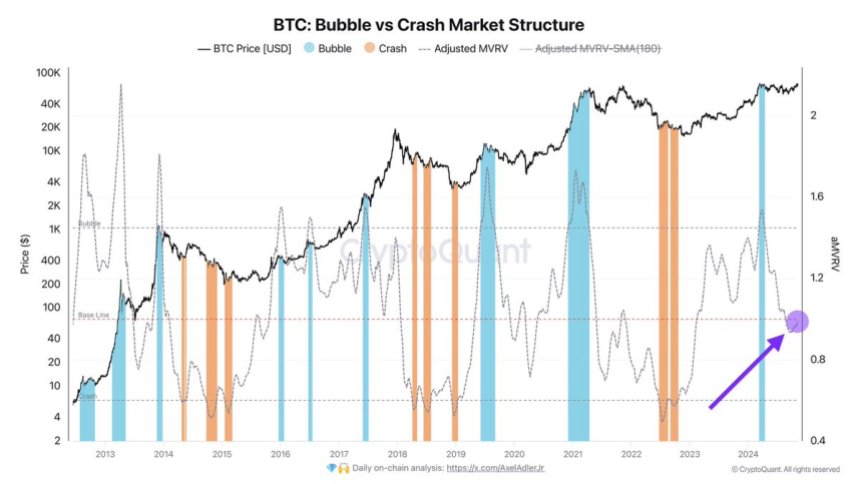
Key data from CryptoQuant indicates that Bitcoin has reached a price equilibrium, suggesting there are no strong market forces pulling the price lower. This positive equilibrium reinforces the bullish outlook and hints at a stable foundation for further growth. Analysts believe Bitcoin may be set for new highs with fewer obstacles in the coming weeks.
As investor confidence builds, some view this phase as a critical moment for Bitcoin to solidify its position in a pro-crypto policy environment. The combination of strong technical support and positive sentiment from Trump’s victory has set the stage for what many hope will be a significant upward trend, potentially driving the broader crypto market higher.
Bitcoin Enters A Bullish Phase
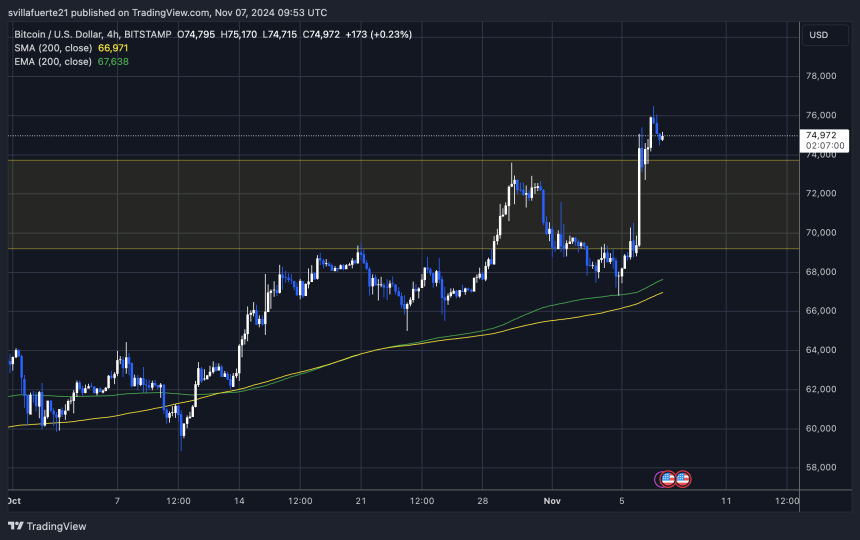
Bitcoin has officially entered a bullish phase after breaking past its previous all-time highs, reaching $76,500. This level has become a new area of focus as many analysts identify it as a potential resistance zone.
According to CryptoQuant analyst Axel Adler, the market is currently balanced between a “Bubble” and a “Crash” phase. Adler’s analysis, which includes key on-chain data, suggests that Bitcoin’s market structure is at an equilibrium, meaning there are no significant fundamental reasons to anticipate a drop. Instead, this setup provides a stable foundation for possibly continuing Bitcoin’s upward trend.

With the Federal Reserve’s interest rate decision set to be announced today, the next few weeks promise to be pivotal. A stable or favorable decision from the Fed could reinforce the optimism in the market, drawing in new demand and reinforcing Bitcoin’s position above $76,000.
Many investors and analysts expect heightened activity from institutional players, particularly given Bitcoin’s resilience around this milestone level. The market’s balance at this juncture is crucial. As long as Bitcoin maintains its current structure, it has the potential to continue its upward trajectory without substantial risk of retracement.
Related Reading
With fresh demand entering the market and the macroeconomic backdrop shaping up favorably, Bitcoin may soon aim for even higher levels. For now, all eyes remain on the $76,500 mark and how the market will respond in the wake of the Federal Reserve’s announcement. This period of consolidation could be the catalyst for the next leg up, solidifying Bitcoin’s bullish outlook.
BTC Key Levels To Watch
Bitcoin is trading at $75,000, holding steady above its previous all-time high of approximately $73,800. This level has become a critical support zone as BTC continues in a well-defined 4-hour uptrend. The trend began after a strong bounce from the 200 exponential moving average (EMA) at $66,800, indicating renewed bullish momentum.

Bulls need to keep the price above the $73,000 mark to sustain this momentum, a key psychological threshold. This level boosts market confidence and provides a potential springboard for Bitcoin to reach higher targets soon. A confirmed hold above $73,000 could signal further upside, inviting additional buying pressure and potentially setting up BTC for new highs.
Related Reading
However, if BTC fails to hold this level, it could slip toward a lower demand area of around $70,500. Despite this possibility, current price action shows no significant signs of a downturn. The steady uptrend and firm support levels suggest that Bitcoin’s bullish outlook remains intact, with little indication of an imminent drop.
As long as BTC maintains its structure, the path toward continued gains remains clear, reinforcing confidence in the ongoing rally.
Featured image from Dall-E, chart from TradingView


