On-chain data shows the Bitcoin Market Value to Realized Value (MVRV) ratio has observed a plunge alongside the latest price crash.
Bitcoin 30-Day MVRV Ratio Is Now At Lowest Levels Since FTX Collapse
As explained by analyst Ali Martinez in a new post on X, the 30-day MVRV ratio has just gone through a sharp drop. The “MVRV ratio” refers to a popular on-chain indicator that, in short, tells us about how the value held by the Bitcoin investors (that is, the market cap) compares against the capital put in by them (the realized cap).
When the value of this ratio is greater than 1, it means the investors as a whole are carrying an unrealized profit right now. On the other hand, it being under the mark suggests the dominance of loss in the market.
Related Reading
In the context of the current topic, the MVRV ratio for the entire market isn’t of interest, but that of just a segment of it: the investors who bought their coins within the past 30 days.
Now, here is a chart that shows the trend in the 30-day Bitcoin MVRV ratio over the past couple of years:
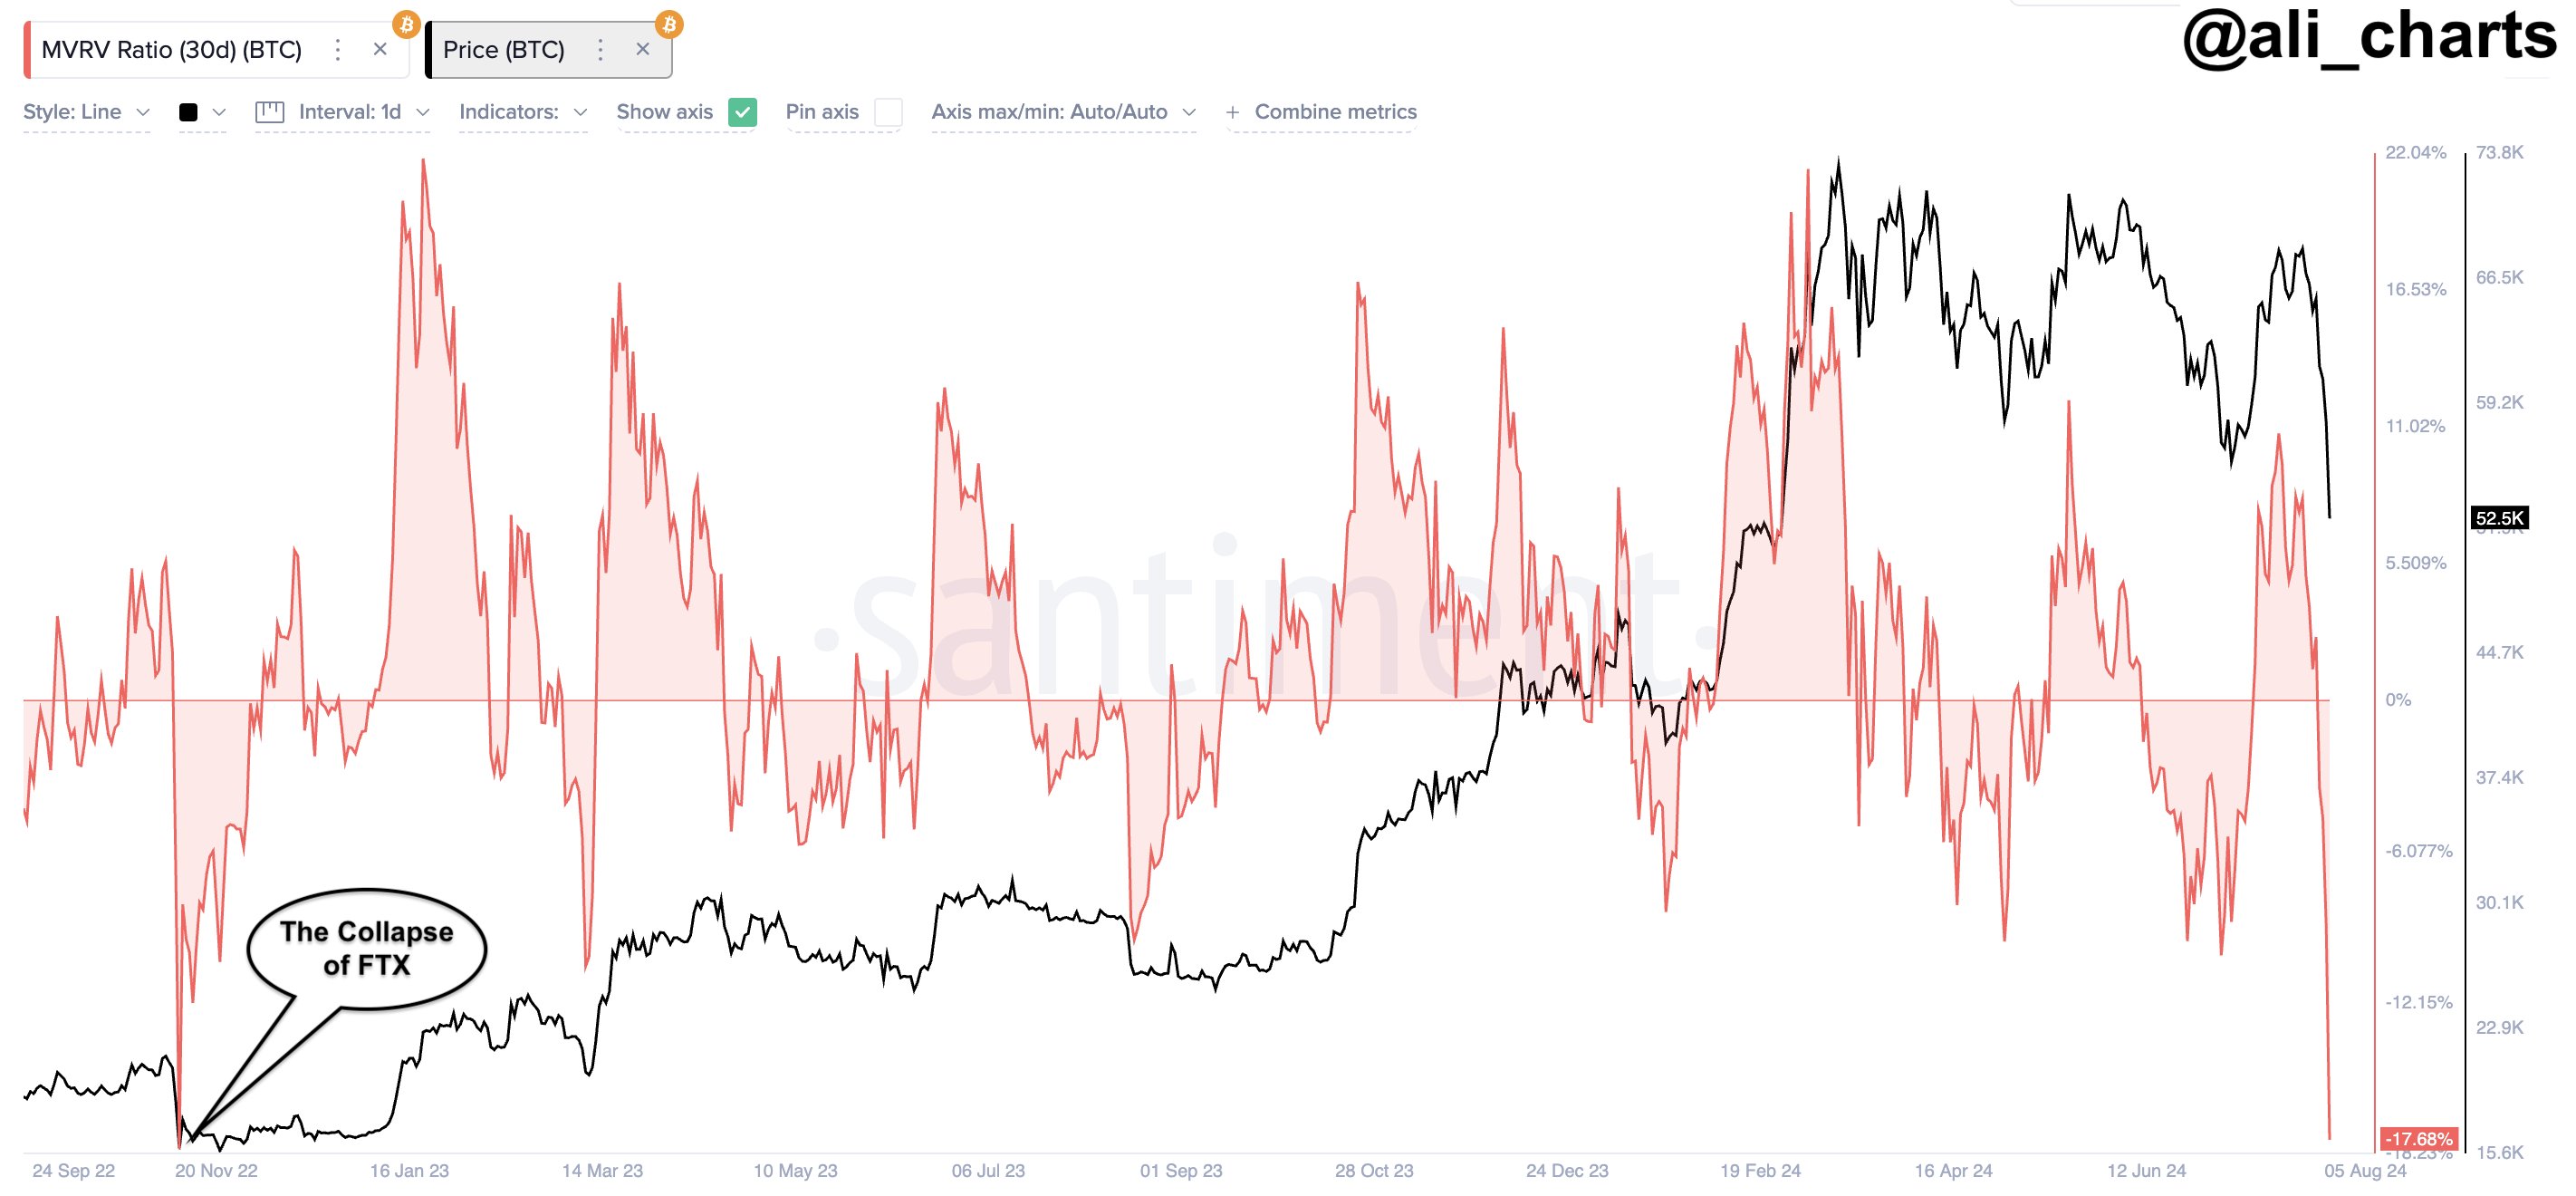
Note that the 30-day Bitcoin MVRV ratio here is displayed as a percentage, with the zero mark essentially taking the same role as the 1 value in the normal version.
From the graph, it’s visible that the indicator had shot up to high levels earlier in the year as the asset had witnessed a rapid surge to a new all-time high (ATH). In the consolidation period that had followed this ATH, though, the metric had fallen to oscillation about the zero mark.
This sideways trajectory, in the price and the indicator, both, has now finally been broken, as the cryptocurrency has observed a crash. The 30-day MVRV ratio has now slumped to sharp negative values of 17%, meaning that the average investor who bought in the past month is 17% in the red right now.
As is apparent in the chart, the last time that the indicator plummeted this low was in November 2022, when the Bitcoin price crashed following the collapse of the cryptocurrency exchange FTX. “That period marked a bottom and an excellent buying opportunity,” notes the analyst.
Related Reading
Generally, when investor profits balloon too much, a top can become likely, as the chances of widespread profit-taking become significant. The price ATH earlier in the year also formed when the indicator had a high value.
In times of high losses, though, selling could be assumed to have reached a state of exhaustion, meaning that a rebound could be probable. Bitcoin saw this in effect during the FTX crash, but it only remains to be seen whether a similar fate also lies in store for it this time.
BTC Price
The early signs of a potential rebound may already be here as the Bitcoin price has made recovery to $54,400 from its low under $50,000.
Featured image from Dall-E, Santiment.net, chart from TradingView.com