Bitcoin price is stuck in a tiny range above the $25,900 support. BTC could start a decent increase if there is a close above $26,200 and then $26,500.
- Bitcoin is struggling to clear the $26,500 resistance zone.
- The price is trading below $26,200 and the 100 hourly Simple moving average.
- There is a connecting bearish trend line forming with resistance near $26,070 on the hourly chart of the BTC/USD pair (data feed from Kraken).
- The pair could attempt a fresh increase if it clears $26,150 and $26,200.
Bitcoin Price Eyes Fresh Increase
Bitcoin price tried to settle above the $26,500 resistance level. However, BTC failed to stay above $26,500 and started a fresh decline.
There was a move below the $26,250 pivot level. The price declined below the 50% Fib retracement level of the upward move from the $25,360 swing low to the $26,780 high. It seems like the price is now stuck in a tiny range above the $25,900 support zone.
Bitcoin is now trading below $26,200 and the 100 hourly Simple moving average. There is also a connecting bearish trend line forming with resistance near $26,070 on the hourly chart of the BTC/USD pair.
On the upside, immediate resistance is near the $26,100 level, the trend line, and the 100 hourly Simple moving average. The first major resistance is now near the $26,200 level, above which the price might rise toward the $26,500 resistance.
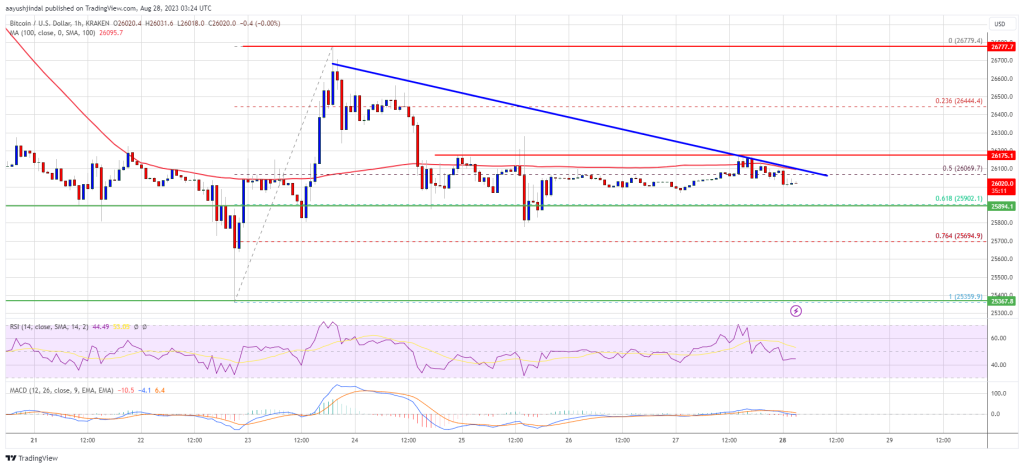
Source: BTCUSD on TradingView.com
To start a strong increase, the price must settle above the $26,500 resistance. In the stated case, the price could test the $27,000 level. Any more gains might set the pace for a larger increase toward $27,800.
More Losses In BTC?
If Bitcoin fails to clear the $26,200 resistance, it could continue to move down. Immediate support on the downside is near the $25,900 zone or the 61.8% Fib retracement level of the upward move from the $25,360 swing low to the $26,780 high.
The next major support is near the $25,400 level. A downside break below the $25,400 level might push the price further lower. In the stated case, the price could drop toward $24,800.
Technical indicators:
Hourly MACD – The MACD is now losing pace in the bearish zone.
Hourly RSI (Relative Strength Index) – The RSI for BTC/USD is now below the 50 level.
Major Support Levels – $25,900, followed by $25,400.
Major Resistance Levels – $26,200, $26,500, and $27,000.