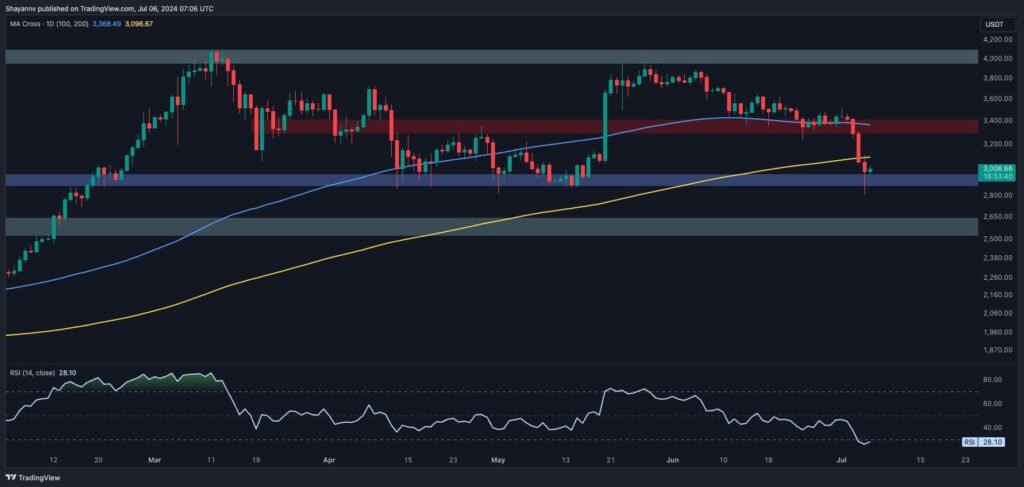
Ethereum has recently experienced increased selling activity, breaching the 100-day moving average and leading to a substantial decline toward the 200-day MA.
Nevertheless, the price faces a significant support region, possibly leading to a temporary period of consolidation correction in the mid-term.
Technical Analysis
By Shayan
The Daily Chart
A close examination of the daily chart reveals that after an extended period of corrective retracements near the crucial 100-day moving average at $3386, sellers ultimately gained control, leading to a break below this key MA.
Given that this area was filled with buying interest and demand, the breach caused a notable long liquidation cascade, accelerating the bearish momentum. As a result, the price plummeted toward the substantial 200-day moving average of $3096 and breached it.
This price action clearly indicates a bearish sentiment in the market, with sellers dominating. However, Ethereum is currently hovering around the crucial and decisive support region of $3K and is expected to undergo a period of consolidation before initiating its next major move. If a pullback to the broken 200-day MA occurs, the continuation of the bearish trend will become more likely.
The 4-Hour Chart
The 4-hour chart shows that following a period of sideways consolidation above the $3.3K support, the price ultimately faced aggressive selling activity and breached this crucial support region. This breakout led to a notable impulsive downtrend, indicating a long-squeeze event in the perpetual markets.
However, Ethereum has landed on the substantial support region of $3K, which has previously supported the price multiple times. This area is likely filled with demand, potentially halting the downward pressures in the short term.
Additionally, the RSI indicator has dropped below 30, indicating potential short-term market correction before the next significant move. Hence, consolidation is likely in the short term, allowing the market to rest and regain momentum. In this scenario, the price range between 0.5 and 0.618 Fibonacci levels will be the main target for the corrective movements in the short term.
Sentiment Analysis
By Shayan
Ethereum has recently seen a rise in selling activity, leading to a significant decline toward the critical $3K support zone.
Understanding the key factors behind this rejection is crucial for predicting upcoming price movements. The accompanying chart highlights potential liquidation zones within Ethereum’s price action, providing valuable insights for mid-term strategies by smart money.
The chart indicates a notable liquidity pool below the crucial $3K. This pool is filled with sell-stop orders from aggressive long positions that contributed to a significant price surge in mid-May. If sellers push the price below the $3K support zone, a massive long-squeeze is expected. This would trigger the sell-stop orders, accelerating the bearish momentum. Traders should closely monitor the price action around the $3K support zone in the upcoming days to determine the cryptocurrency’s trend direction.
The post Ethereum Price Analysis: ETH Holds at $3K but is Another Crash Imminent? appeared first on CryptoPotato.
