Ethereum price recovered from the $1,985 zone. ETH is showing positive signs and might rise further if it clears the $2,075 resistance.
- Ethereum is recovering higher from the $1,985 zone.
- The price is trading above $2,040 and the 100-hourly Simple Moving Average.
- There was a break above a key bearish trend line with resistance near $2,040 on the hourly chart of ETH/USD (data feed via Kraken).
- The pair could gain bullish momentum if it stays above the 100-hourly Simple Moving Average.
Ethereum Price Eyes Fresh Increase
Ethereum price spiked before the $2,000 support before the bulls appeared. ETH traded as low as $1,986 and recently started a recovery wave, like Bitcoin.
There was a decent increase above the $2,020 level. The price climbed above the 23.6% Fib retracement level of the downward move from the $2,132 swing high to the $1,986 low. Besides, there was a break above a key bearish trend line with resistance near $2,040 on the hourly chart of ETH/USD.
Ethereum is now trading above $2,040 and the 100-hourly Simple Moving Average. On the upside, the price is facing resistance near the $2,075 zone. It is close to the 61.8% Fib retracement level of the downward move from the $2,132 swing high to the $1,986 low.
The first key resistance is near the $2,100 level. The next resistance sits at $2,130. A clear move above the $2,130 level could send the price toward the $2,150 resistance zone.
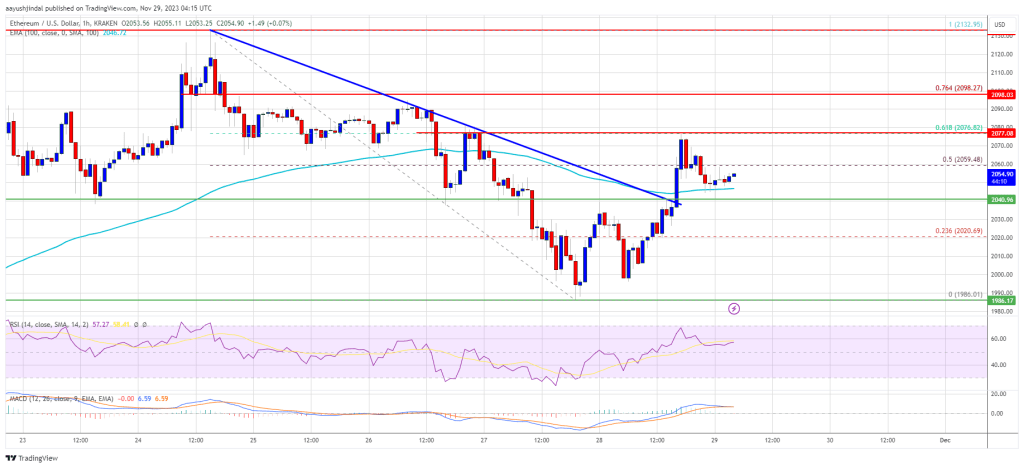
Source: ETHUSD on TradingView.com
The next resistance is near $2,220, above which the price could aim for a move toward the $2,265 level. Any more gains could start a wave toward the $2,320 level.
Another Decline in ETH?
If Ethereum fails to clear the $2,075 resistance, it could start a fresh decline. Initial support on the downside is near the $2,045 level and the 100-hourly Simple Moving Average, below which the bears might gain strength.
The next key support is $2,000. A downside break below $2,000 might spark a strong bearish move. The key support is now at $1,930, below which there is a risk of a move toward the $1,880 level in the near term.
Technical Indicators
Hourly MACD – The MACD for ETH/USD is losing momentum in the bullish zone.
Hourly RSI – The RSI for ETH/USD is now above the 50 level.
Major Support Level – $2,045
Major Resistance Level – $2,075