The year 2025 has not exactly gone as planned for the crypto industry, as bearish pressure continues to envelop the market. Following the recent downturn that shook the crypto market, the Bitcoin price is now trading nearly 25% beneath its all-time high.
According to data from CoinGecko, the price of Bitcoin is down by roughly 12% in the past seven days. What’s worse is that the latest price data suggests that the decline might not yet be over for the premier cryptocurrency.
The Current Outlook For BTC Price
In a February 28 post on social media platform X, crypto analyst Ali Martinez put forward another bearish outlook for the Bitcoin price in the current market condition. According to the internet pundit, the price of BTC could fall towards $74,700 to find relief from the ongoing correction.
The rationale behind this prediction is the movement and the crucial nature of the 50-week moving average on the Bitcoin weekly chart. Martinez noted that the price of BTC historically tends to find support and bounce off above this long-term moving average.
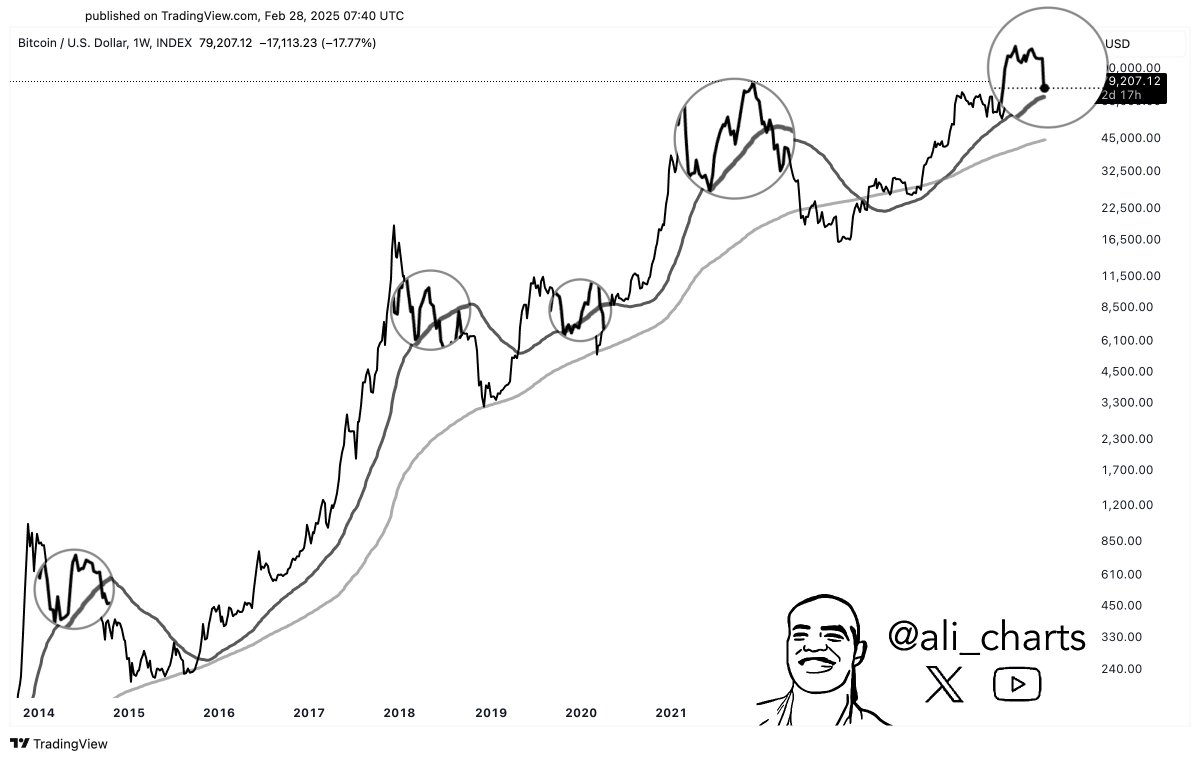
Source: Ali_charts/X
As shown in the chart above, the Bitcoin price has experienced deep corrections in past cycles, which often bounces off the 50-week moving average. Most recently, the flagship cryptocurrency found support at the moving average in July 2021, rebounding to the then-all-time high of around $62,000 before reaching the $67,737 cycle top.
Going by this historical precedence, it appears that the Bitcoin price might be at risk of further downward movement, with the next support around $74,700. However, if this crucial support level holds strong, the market leader could bounce back to its previous all-time high price and even beyond.
On the flip side, if the price of BTC breaches the 50-week moving average to the underside, the premier cryptocurrency could be in for an extended correction period. Using previous cycles as a template in analyzing this bearish case, the Bitcoin price is at risk of commencing its bear market if it breaks the 50W moving average.
In the last cycle — after breaching the 50-week moving average, the price of Bitcoin declined from around $68,000 to beneath $17,000 — a 75% decline — in just about a year. However, it is worth mentioning that this downturn might have been exaggerated due to the collapse of Terra Luna and FTX exchange in 2022.
Bitcoin Price At A Glance
As of this writing, the price of BTC sits just above the $85,200 mark, reflecting no significant change in the past 24 hours.
The price of BTC on the daily timeframe | Source: BTCUSDT chart on TradingView
Featured image from iStock, chart from TradingView