- Litecoin started a downside correction from the $105 zone against the US Dollar.
- LTC price is now trading above $85 and the 55 simple moving average (4 hours).
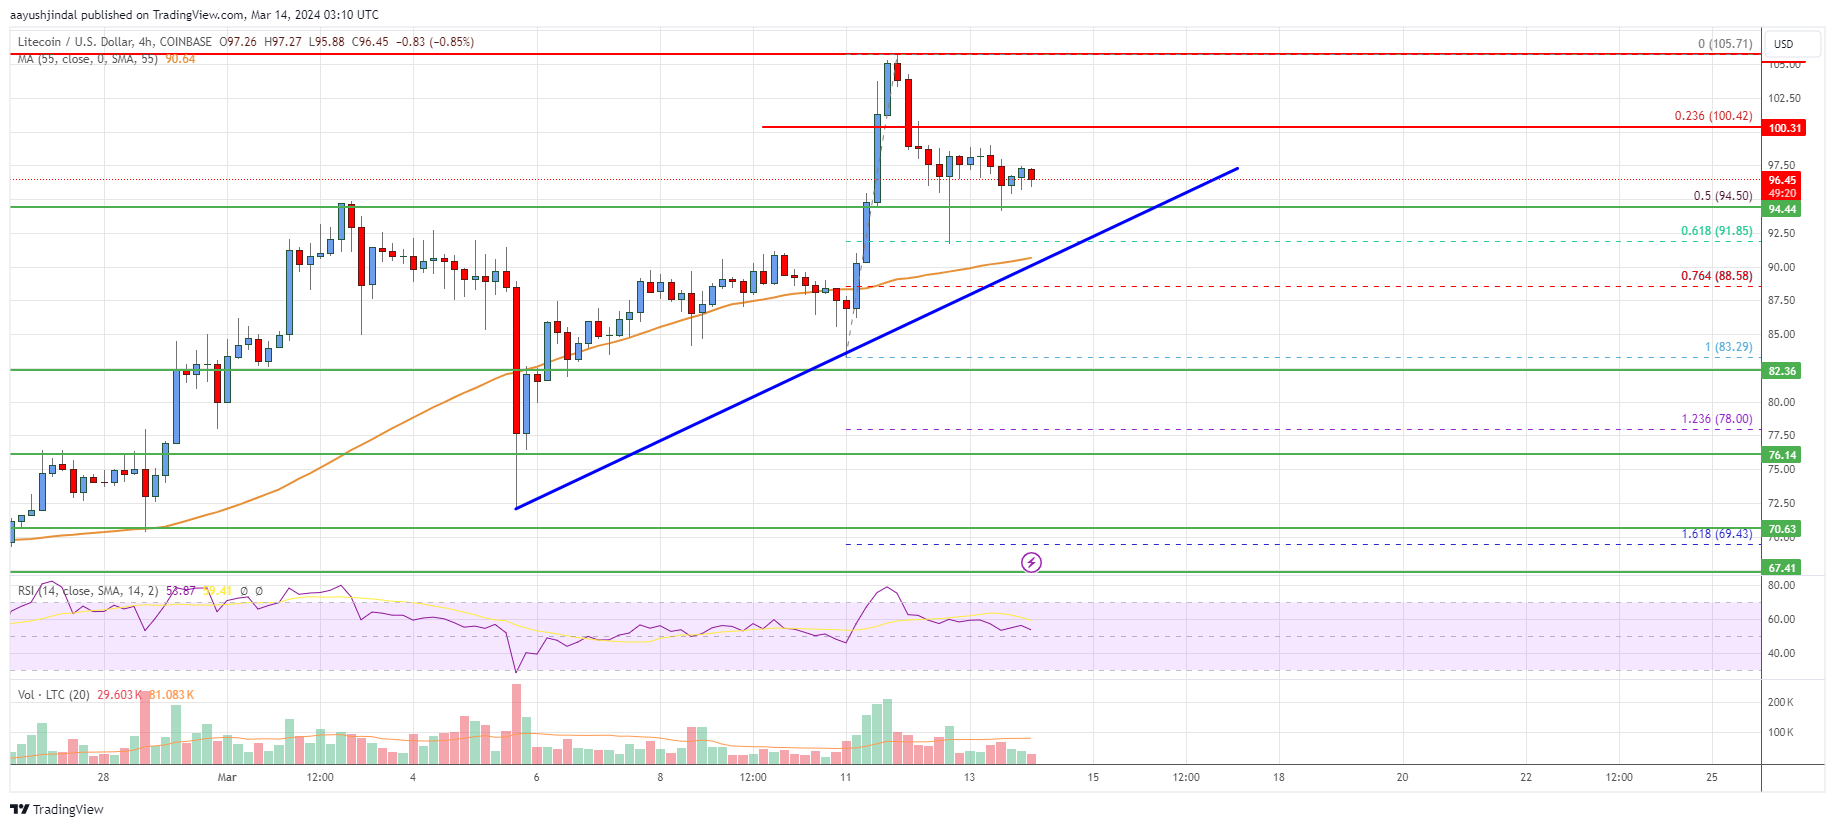
- There is a key bullish trend line forming with support near $94.00 on the 4-hour chart of the LTC/USD pair (data feed from Coinbase).
- The pair could start a fresh increase if it stays above the $90 support.
Litecoin price is correcting gains from $105.00 against the US Dollar, like Bitcoin. LTC price could resume its increase if it remains well supported above the $90.00 level.
Litecoin Price Analysis
In the past few days, there was a steady decline in Bitcoin, Ethereum, Ripple, and Litecoin against the US Dollar. Earlier, LTC formed a base above the $85 level and started a fresh increase.
There was a clear move above the $92 and $95 resistance levels. The price even climbed above the $100 level and the 55 simple moving average (4 hours). However, the bears were active near the $105.00 zone. The recent high was formed near $105.71 and the price started a downside correction.
There was a move below the $100 level. The price traded below the 23.6% Fib retracement level of the upward move from the $83.29 swing low to the $105.71 high.
Litecoin is now trading above $85 and the 55 simple moving average (4 hours). On the upside, the price is facing resistance near the $100.00 level. The next major resistance sits near the $105.00 level. A clear move above the $105.00 level could pump the price toward the $125 level. Any more gains might call for a test of $140.
Immediate support is near the $94 level. The next major support is near the $92.20 zone or the 50% Fib retracement level of the upward move from the $83.29 swing low to the $105.71 high. A downside break below the $72.20 support might start a strong decline.
Looking at the chart, Litecoin price is trading above $92 and the 55 simple moving average (4 hours). Overall, the price could start a fresh increase if it stays above the $90 support.
Technical indicators
4 hours MACD – The MACD for LTC/USD is now losing pace in the bullish zone.
4 hours RSI (Relative Strength Index) – The RSI for LTC/USD is now above the 50 level.
Key Support Levels – $92.20 and $90.00
Key Resistance Levels – $100.00 and $105.00.