TON has experienced a dramatic price shift, falling below $7.7 three days after reaching an all-time high of $8.2. This sudden decline has caught the attention of investors and market analysts, raising concerns and sparking discussions about the potential implications of this sharp reversal.
It also follows a period of intense volatility and highlights the unpredictable nature of the cryptocurrency market. With TON’s price trajectory undergoing significant fluctuations, it’s essential to examine the factors contributing to this downturn and explore what this could mean for the future of TON and its investors.
This article delves into an analysis of the recent price movements and potential outcomes of TON’s sudden drop after setting a record high. As of the time of writing, TON has a market capitalization of over $18 billion, a trading volume of over $472 million, and a price drop of 4.03%, trading at around $7.3 over the past 24 hours. Despite a decline of 5.77% in market capitalization, the trading volume for TON is up by 40.90%.
Market Volatility And Recent Price Movements For TON
On the 4-hour chart, TON is currently attempting a break below the 100-day Simple Moving Average (SMA) after it has successfully broken the $7.7 support mark.

A careful examination of the 4-hour Composite Trend Oscillator indicator suggests that TON may actively go bearish as the signal line and the SMA of the indicator are attempting to cross below the zero line.
Meanwhile, on the 1-day chart, TON’s price is currently declining toward the $6.7 support mark. It can be observed here that after TON hit its all-time high of $8.2, the crypto asset has been dropping down with strong bearish momentum candlesticks.
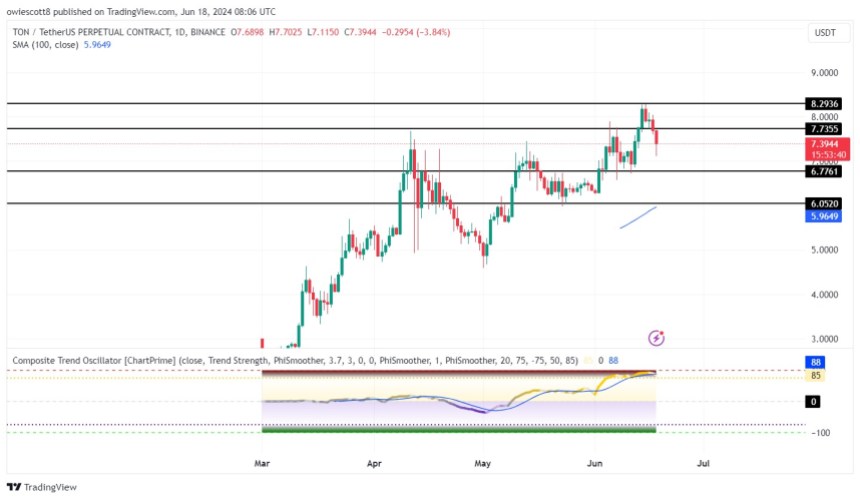
Additionally, the signal line and SMA of the Composite trend oscillator indicator on the 1-day chart are currently trending in the overbought section, with the signal line attempting a cross below the SMA, indicating a bearish move could be on the horizon.
Thus from the 4-hour and 1-day price actions and formation of the indicator used for this analysis, it can be suggested that the price of TON may actively go bearish.
Technical Analysis: Key Support And Resistance Levels
TON’s abrupt fall below $7.7 after reaching an all-time high of $8.2 underscores the inherent volatility and unpredictability of the cryptocurrency market. Consequently, if the price of TON continues to move downward below the 100-day SMA toward the $6.7 support level and breaks below it, it may decline further to challenge the $6.05 support level.
However, if TON’s price fails to break below the $6.7 support mark, it will begin to ascend toward the $7.7 resistance level again. TON could ascend further to challenge the $8.2 resistance mark and possibly move on to set a new high if this level is breached.