Join Our Telegram channel to stay up to date on breaking news coverage
The Ripple price prediction shows that XRP may consolidate as the coin faces the downside, and traders may experience a downward movement.
Ripple Prediction Statistics Data:
- Ripple price now – $0.66
- Ripple market cap – $35.4 billion
- Ripple circulating supply – 53.6 billion
- Ripple total supply – 99.98 billion
- Ripple CoinMarketCap ranking – #5
XRP/USD Market
Key Levels:
Resistance levels: $0.80, $0.85, $0.90
Support levels: $0.55, $0.50, $0.45

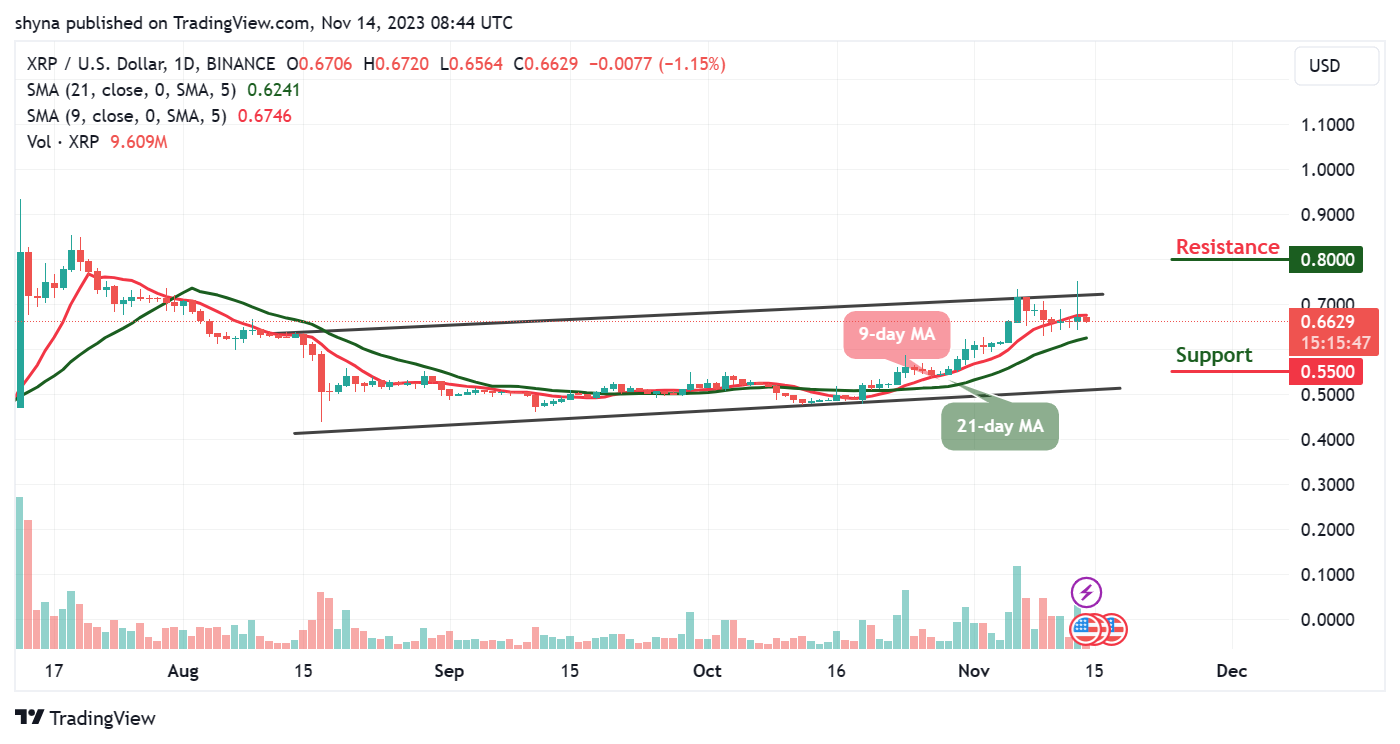
XRP/USD could be facing a market-wide struggle after sliding below the 9-day and 21-day moving averages. The coin is likely to stay within this negative side before deciding on the bullish movement. The current movement toward the lower boundary of the channel may create more damage to the coin for touching the low of $0.65.
Ripple Price Prediction: XRP Heads to the Downside
At the time of writing, the Ripple price is likely to be slightly below the daily low of $0.65, and any bearish cross below this support may open the doors for more downsides as the price could hit another support at $0.64.
However, if the buyers return to the market, traders should keep an eye on the daily high at $0.67 before creating a new bullish trend toward the resistance levels of $0.80, $0.85, and $0.90.
Nonetheless, should the price fail to rebound, it is likely for a bearish breakout to trigger more selling opportunities within the market, which might cause the price to retest the support level of $0.65 and could further drop to $0.55, $0.50, and $0.45 support levels. Meanwhile, the 9-day MA is above the 21-day MA, suggesting that the bulls may come back to the market.
XRP/BTC Trades Bearishly
Against Bitcoin, the Ripple price is seen moving within the 9-day and 21-day moving averages. However, if the selling pressure continues, the Ripple price variation may head toward the lower boundary of the channel and may allow the coin to hit the nearest support at 1700 SAT. Therefore, traders may continue to see negative moves within the market.
At the time of writing, XRP/BTC is hovering at 1806 SAT as traders may expect critical support at 1600 SAT and below. Meanwhile, if a bullish movement occurs and breaks above the 9-day moving average; traders may confirm a bullish movement, and the potential resistance level could be found at 2100 SAT and above.
Alternatives to Ripple
At the time of writing, the Ripple price is likely to be slightly below the daily low of $0.65, and any bearish cross below this support may open the doors for more downsides as the price could hit the nearest support at $0.60. Meanwhile, traders should take note of the daily high at $0.70 before creating a new bullish trend toward the upper boundary of the channel.
On that note, Ripple (XRP), ranked fifth on CoinMarketCap, is expected to show more stable and modest gains due to its established status and significant market capitalization. In contrast, the Bitcoin Minetrix, currently in presale, has a lower market cap and potential for substantial growth, making it an appealing choice for investors seeking higher-risk, higher-reward opportunities. The nearly $4m raised in its presale indicates a growing interest in BTCMTX and its potential for significant upside.
New Crypto Mining Platform – Bitcoin Minetrix
- Audited By Coinsult
- Decentralized, Secure Cloud Mining
- Earn Free Bitcoin Daily
- Native Token On Presale Now – BTCMTX
- Staking Rewards – Over 100% APY
Join Our Telegram channel to stay up to date on breaking news coverage
