Solana (SOL) price is currently on a bullish move, climbing over 5% in the last 24 hours with strong bullish momentum toward the $160 resistance mark. Analyzing Solana’s growing momentum reveals that it could be fueled by recent active buyers’ activity in the market and optimism that the digital asset could be poised for further gain.
As Solana draws closer to the $160 mark, we will delve into an in-depth examination of SOL’s upswing based on current price actions, and key indicators supporting this upward trend, exploring what this means for SOL’s future price prospects.
SOL’s price is currently trading at around $153 and has increased by 5.66% with a market capitalization of over $71 billion and a trading volume of over $2 billion as of the time of writing. In the last 24 hours, SOL’s market cap and trading volume have experienced an increase of 5.68% and 28.45% respectively.
Analyzing Technical Indicators Supporting SOL’s Bullish Trend
Currently, the price of Solana on the 4-hour chart with bullish momentum has risen above the 100-day Simple Moving Average (SMA) and the 4-hour bearish trendline. The digital asset has been able to maintain its bullish sentiment since these breaks and could continue its upward move toward the $160 resistance level.
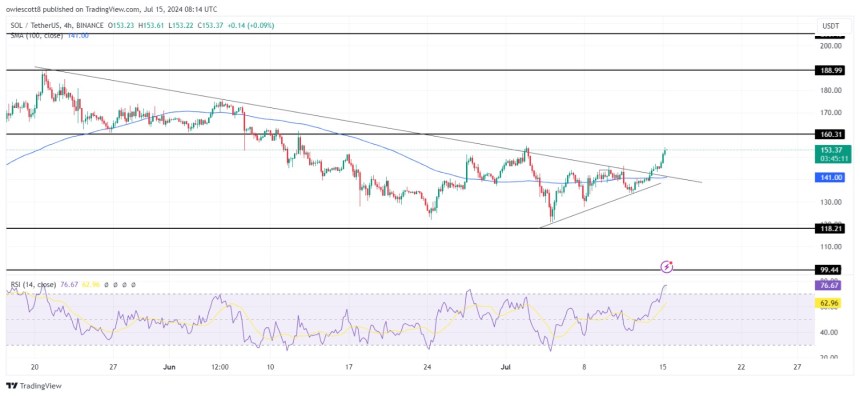
Also, the formation of the 4-hour Relative Strength Index (RSI) suggests that SOL’s price may continue its bullish move toward the $160 resistance level as the signal line of the RSI indicator has been maintaining its bullish sentiment above 50% and is currently trending the overbought zone.
On the 1-day, the price of SOL has broken above the bearish trendline, and it can be observed that the crypto asset is currently attempting a bullish move above the 100-day SMA towards the $160 resistance level. Since the break above the bearish trendline, Solana has been showing bullish resilience, keeping a steady pace toward the $160 mark.
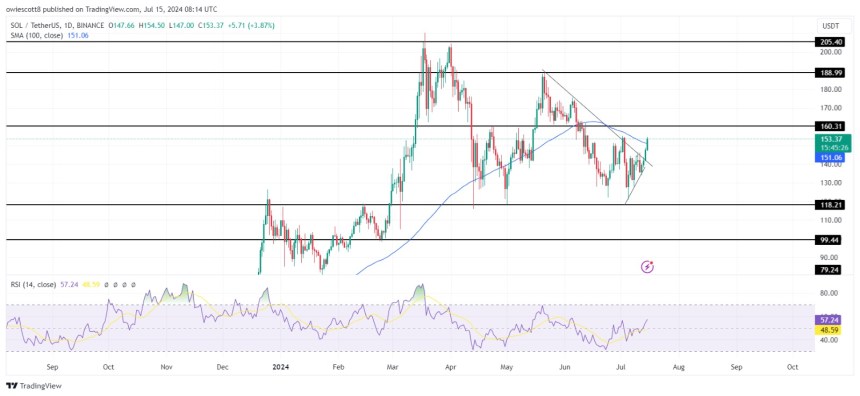
Finally, on the 1-day chart, a careful examination of the formation of the 1-day RSI reveals that SOL could sustain its bullish trend above the 1-day SMA and the bearish trendline toward the $160 resistance mark as the signal line of the indicator has risen above 50% and is currently attempting a move towards the oversold zone.
Resistance And Support Levels For Solana To Watch
If SOL can maintain its current bullish momentum to hit the $160 resistance level and close above, it may continue to move upward to challenge the $188 resistance level. When this level is breached, the digital asset may experience further price gain toward the $205 resistance level and possibly other levels above.
Conversely, should SOL pull back at $160, it will start to decline once more toward the $118 support level. Following a break below this level, the crypto asset may see further price decline to challenge the $99 support level and perhaps other levels below.