

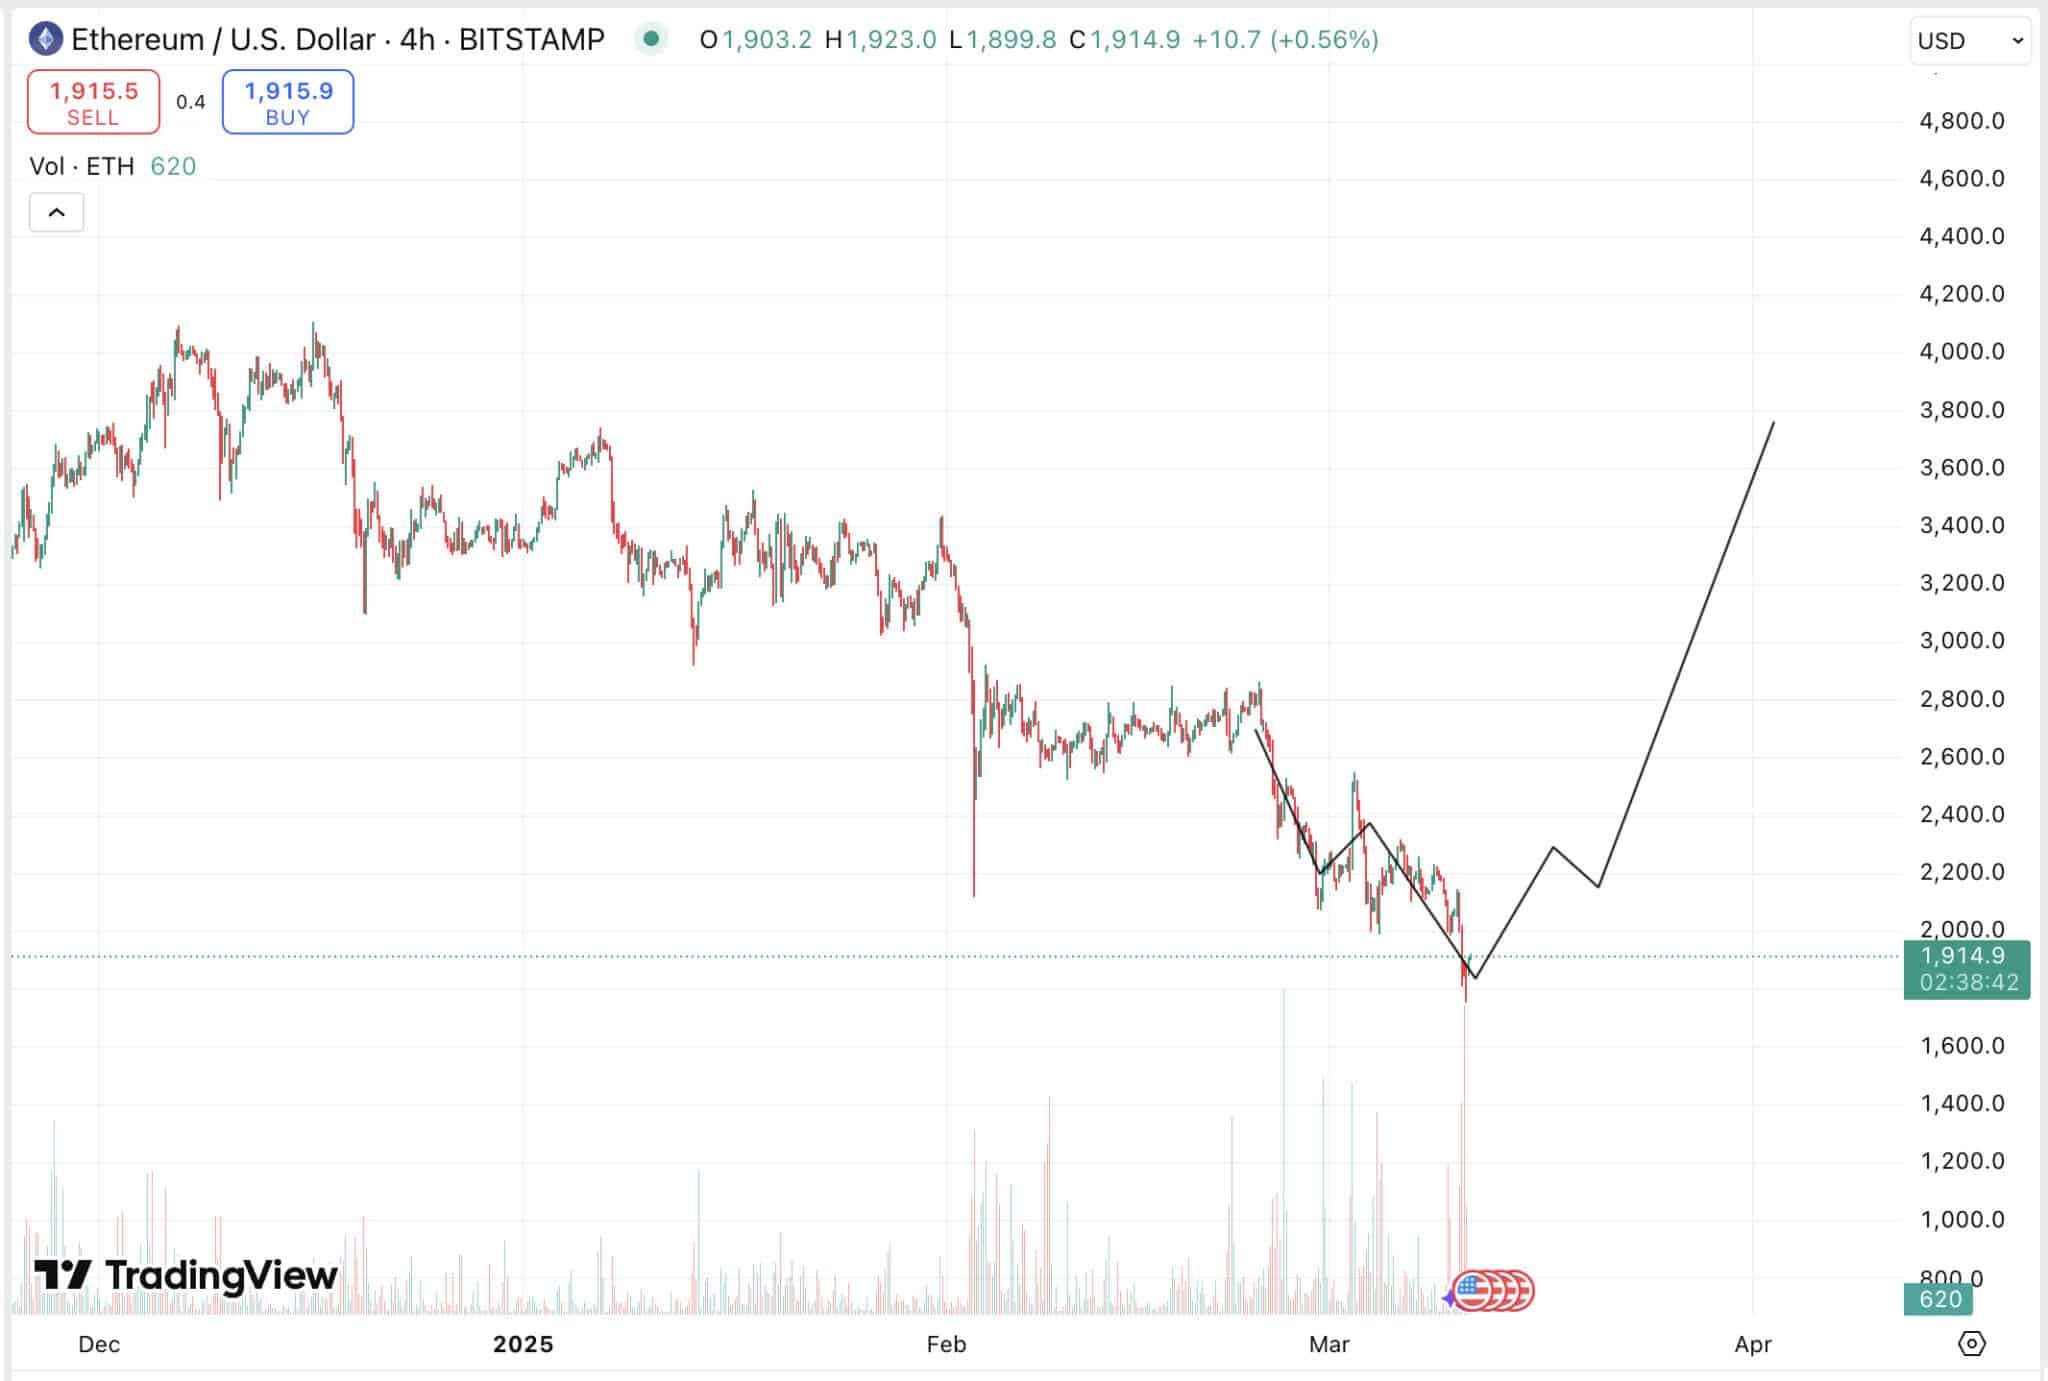
Ethereum (ETH) is staging a chart recovery by showing signs of a bullish turnaround. After a rocky start to the year, with prices dipping below $2,000, Ethereum as the second-largest crypto is flashing oversold signals, hinting at a powerful rebound.
Technical indicators and market dynamics imply ETH about to reclaim higher chart levels soon.
The current price consolidation is just below $2,000, showing optimism as it is oversold. Analysts point to historical patterns where ETH has bounced back from similar lows, like its $1,600 bottom in 2023. With the market at a total fear, Ethereum’s chart is carving out a promising recovery course.
Ethereum on the Verge of Chart Recovery: Here’s Why ETH Price Will Reverse
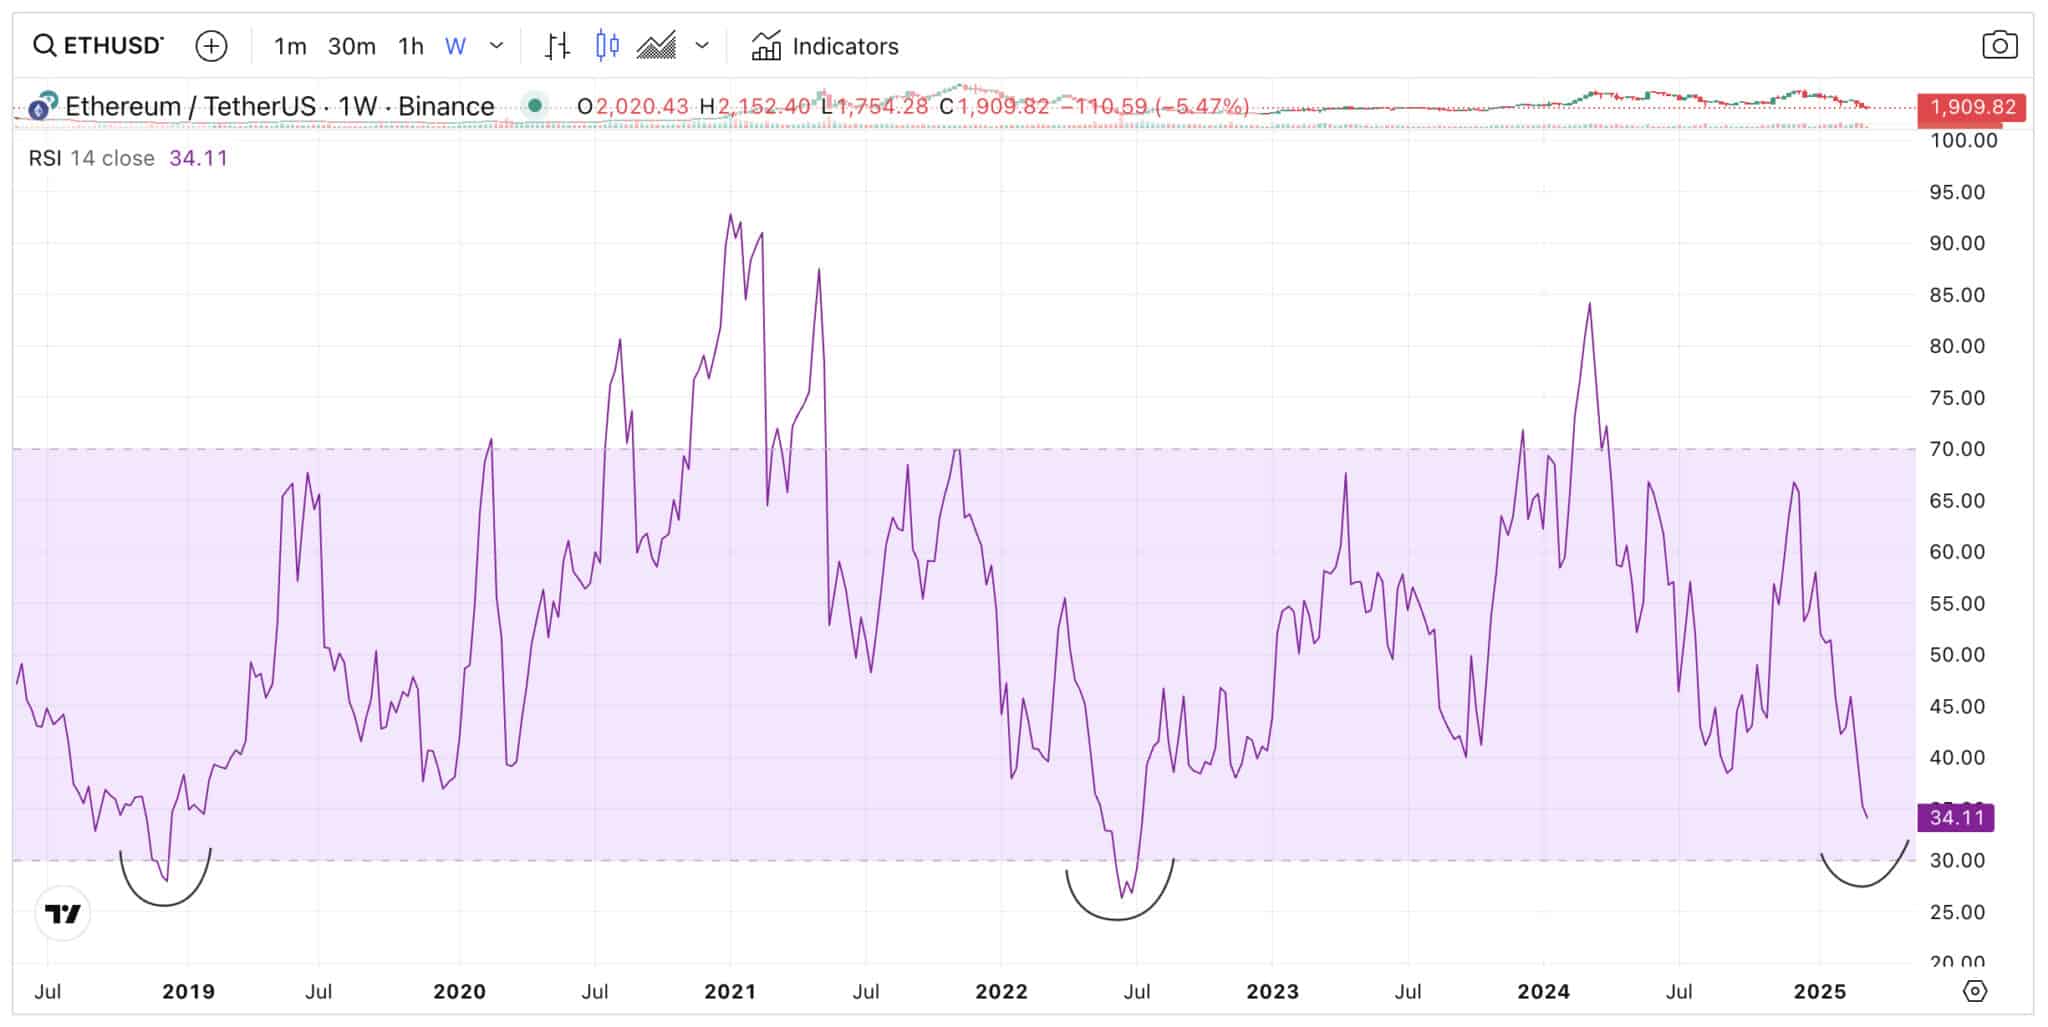
The Ethereum oversold condition is reflected in the RSI level. When RSI dips too low, it usually signals a reversal, and ETH’s current reading is at levels seen before in its 160% rally in late 2023. This technical setup is drawing speculation of a climb past $2,600. ETH is trading at a discount, which is ripe for a bullish breakout.

(source)
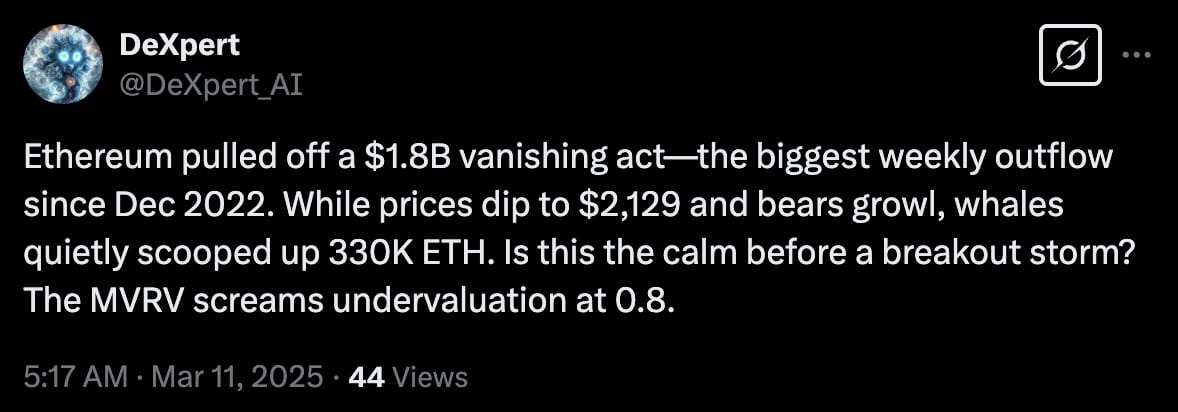
Adding to the momentum, Ethereum’s MVRV Z-Score has hit a 17-month low. Historically, such undervaluation has preceded explosive price pumps, like the rally to $4,000 during Q4 2023.
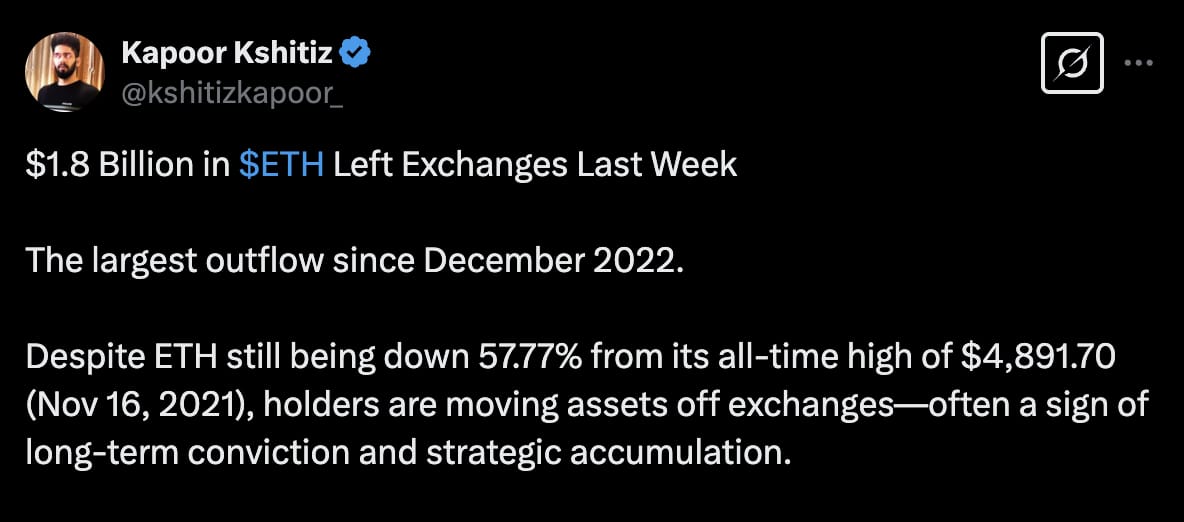
On-chain data also supports the case for a recovery. Ethereum outflows from exchanges recently hit their highest levels since years ago, with $1.8 billion in ETH withdrawn. This massive movement indicates buyers scoop up coins at perceived lows, reducing selling pressure and setting the stage for a price uptick.

(source)
Whale activity is another bullish signal lighting up the charts. Large investors holding 1,000 to 10,000 ETH have accumulated during this dip, a trend that foreshadows price increases.
Whales’ confidence in Ethereum’s long-term valuation can propel ETH toward key resistance levels like $2,518 or even $3,000.
The Ethereum network is resilient, maintaining dominance in DEX volume at $22.45 billion over seven days. Despite competition from Solana, the Ethereum ecosystem, driven by staking, lending, and layer-2 solutions, continues to attract users.
These, too, reinforce ETH’s fundamental strength and support a bullish price recovery.

(source)
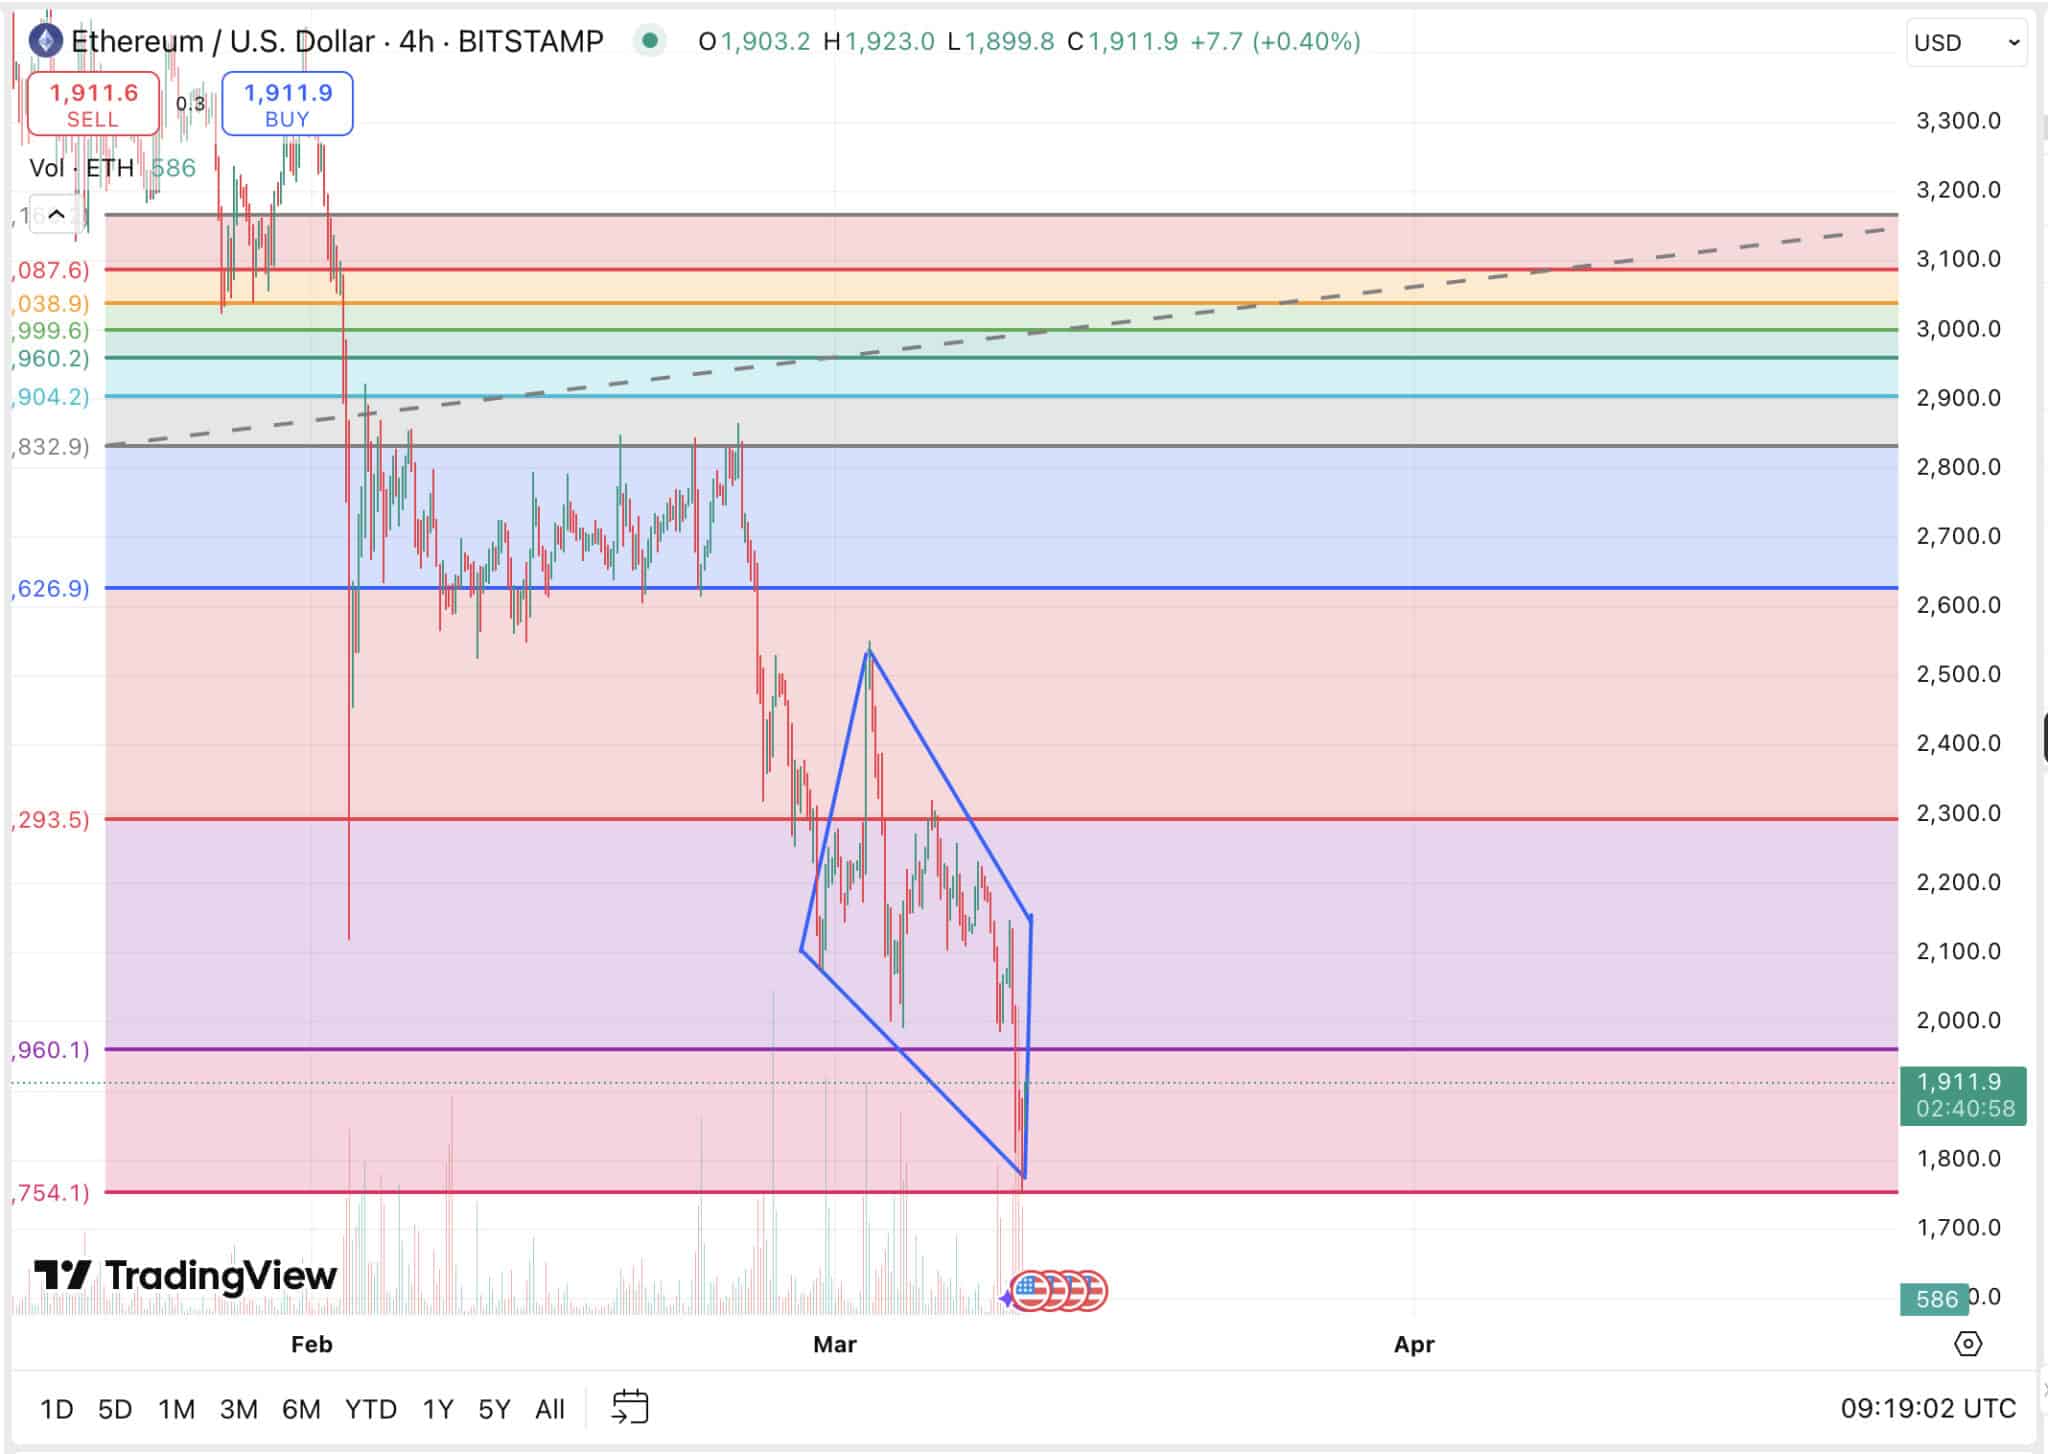
The technical analysis reveals a diamond pattern forming on the Ethereum four-hour chart, a classic recovery signal. Analysts note that breaking above the 0.382 Fibonacci level at $2,518 could open the door to $3,000, with $3,420 as the next target. This aligns with growing trader optimism for a sustained uptrend.

(source)
The upcoming Pectra upgrade is another catalyst pumping excitement. It is set to enhance user experience and validator staking limits from 32 ETH to 2,048 ETH, and it will reduce sell pressure over time.
While not an immediate price driver, Pectra lays the groundwork for Ethereum’s next leg up in 2025.
Market Sentiment: Major Driver for Bullish ETH Chart
Market sentiment is also shifting positively, buoyed by external factors like US crypto policies under President Trump. Even with the current crypto valuation, his strategic reserve plans have lifted general crypto confidence. This momentum will push Ethereum past the psychological barriers of $2,600.
Competition from Solana is losing steam. Solana’s meme coin frenzy has faded, and its potential spot ETF approval in 2025 remains uncertain. Meanwhile, ETH, with its first-mover advantage and established infrastructure, has an edge, reassuring traders of its ability to reclaim bullish territory.
Ethereum’s price action aligns with a Wyckoff Reaccumulation Pattern, a structure signaling accumulation before a breakout. If ETH clears resistance, analysts are predicting a revisit to $4,000 by Q2. The slow uptrend remains intact, testing bearish defenses that may soon crumble.

(source)
Layer-2 interoperability issues, a past concern, are nearing resolution. Experts say that within months, Ethereum’s scaling solutions will enhance liquidity and accessibility, boosting network utility.
This development will draw more capital, supporting the Ethereum price chart recovery as investor confidence strengthens.
Ethereum’s market has shown resilience despite a $1.4 billion hack on Bybit in February. On-chain data indicates no significant sell-off followed, and exchange reserves are rebounding. This shows the ETH price’s ability to weather shocks, reinforcing its bullish narrative as it rebuilds the chart from here.
Finally, the 30-day ETH futures premium has risen to 7%, up from 6%, easing bearish pressure below $2,600. This is bullish for sentiment; expect Ethereum to get into the higher returns zone soon.
With these factors converging, the Ethereum crypto chart points to a recovery course aiming well beyond $2,600.

(source)
Ethereum’s oversold state, whale accumulation, and technical setups paint a bright picture. As the network strengthens and market conditions align, ETH will reclaim $2,600 key level and beyond. The recovery is underway, and the bulls are ready to charge. Ethereum is the crypto for people.
DISCOVER: Next 1000X Crypto: 10+ Crypto Tokens That Can Hit 1000x in 2025
Join The 99Bitcoins News Discord Here For The Latest Market Updates
Key Takeaways
- Ethereum chart recovery is getting closer, deep diving into the drivers.
- ETH market sentiment is gradually getting more bullish as fear subsides.
The post This is How Ethereum Price Can Rebuild From Here: ETH Price Charts Recovery Course appeared first on 99Bitcoins.