- Bitcoin price started a strong increase above the $68,000 zone against the US Dollar.
- The price is now trading above $70,000 and the 55 simple moving average (4 hours).
- There is a key bullish trend line forming with support at $69,800 on the 4-hour chart of the BTC/USD pair (data feed from Coinbase).
- The pair could continue to rise if it stays above the $68,000 support zone.
Bitcoin price is showing positive signs above $70,000 against the US Dollar. BTC might correct lower, but dips could be limited below the $68,000 zone.
Bitcoin Price Analysis
Bitcoin price started a strong increase above the $66,500 resistance zone. The price remained stable above the $68,000 level and traded in a positive zone.
The price even rallied above the $70,000 resistance zone. However, the price seems to be struggling near the $73,000 zone. A new all-time high was formed near $73,027 and the price is now consolidating gains. The price traded below $72,000 but it is still above the 23.6% Fib retracement level of the upward move from the $59,224 swing low to the $73,027 high.
Bitcoin is now trading above $70,000 and the 55 simple moving average (4 hours). Immediate resistance on the upside is near the $72,800 level. The first major resistance is near the $73,000 level, above which the price could rise toward the $75,000 zone.
Any more gains might send the price toward the $80,000 zone. If there is no upside break, the price might start a downside correction below $71,000. There is also a key bullish trend line forming with support at $69,800 on the 4-hour chart of the BTC/USD pair.
The next key support is near the $68,000 level. Any more losses might call for a move toward the 50% Fib retracement level of the upward move from the $59,224 swing low to the $73,027 high at $66,100.
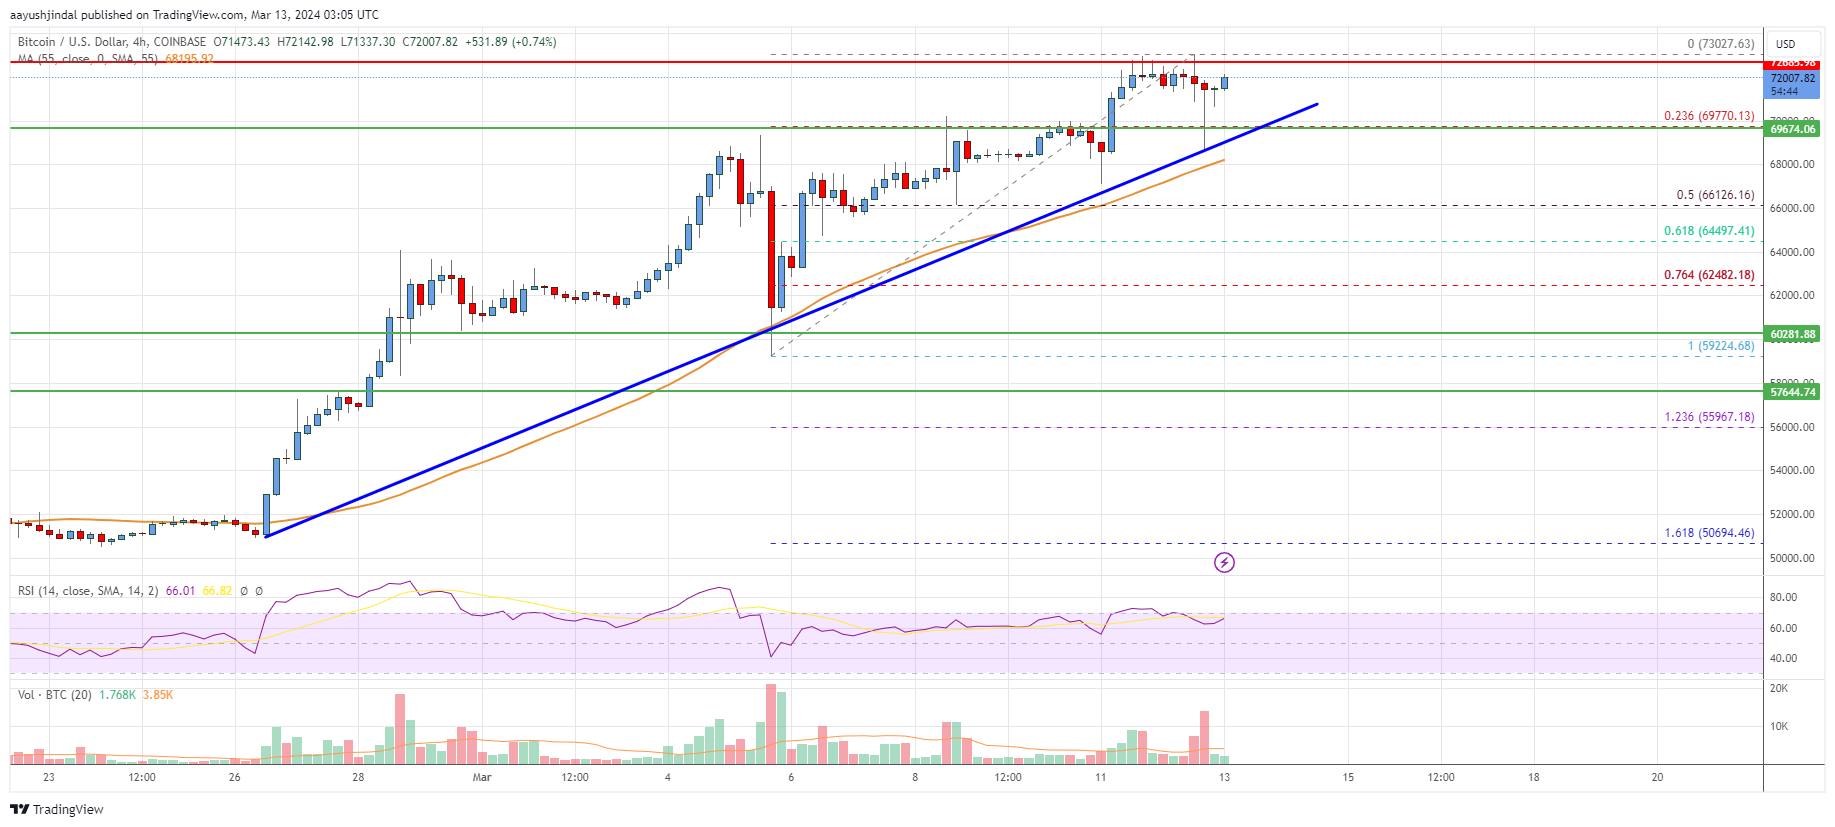
Looking at the chart, Bitcoin price is trading above $70,000 and the 55 simple moving average (4 hours). Overall, the price could continue to rise if it stays above the $68,000 support zone.
Technical Indicators
4 hours MACD – The MACD is now gaining momentum in the bullish zone.
4 hours RSI (Relative Strength Index) – The RSI is now above the 50 level.
Key Support Levels – $70,000 and $68,000.
Key Resistance Levels – $72,500, $73,000, and $75,000.