Ethereum’s price is yet to show any strong sign of recovery after a significant rejection from the $2,700 level. Yet, the price is testing a key level at the moment, which could soon determine whether the market will recover or drop even lower.
Technical Analysis
By TradingRage
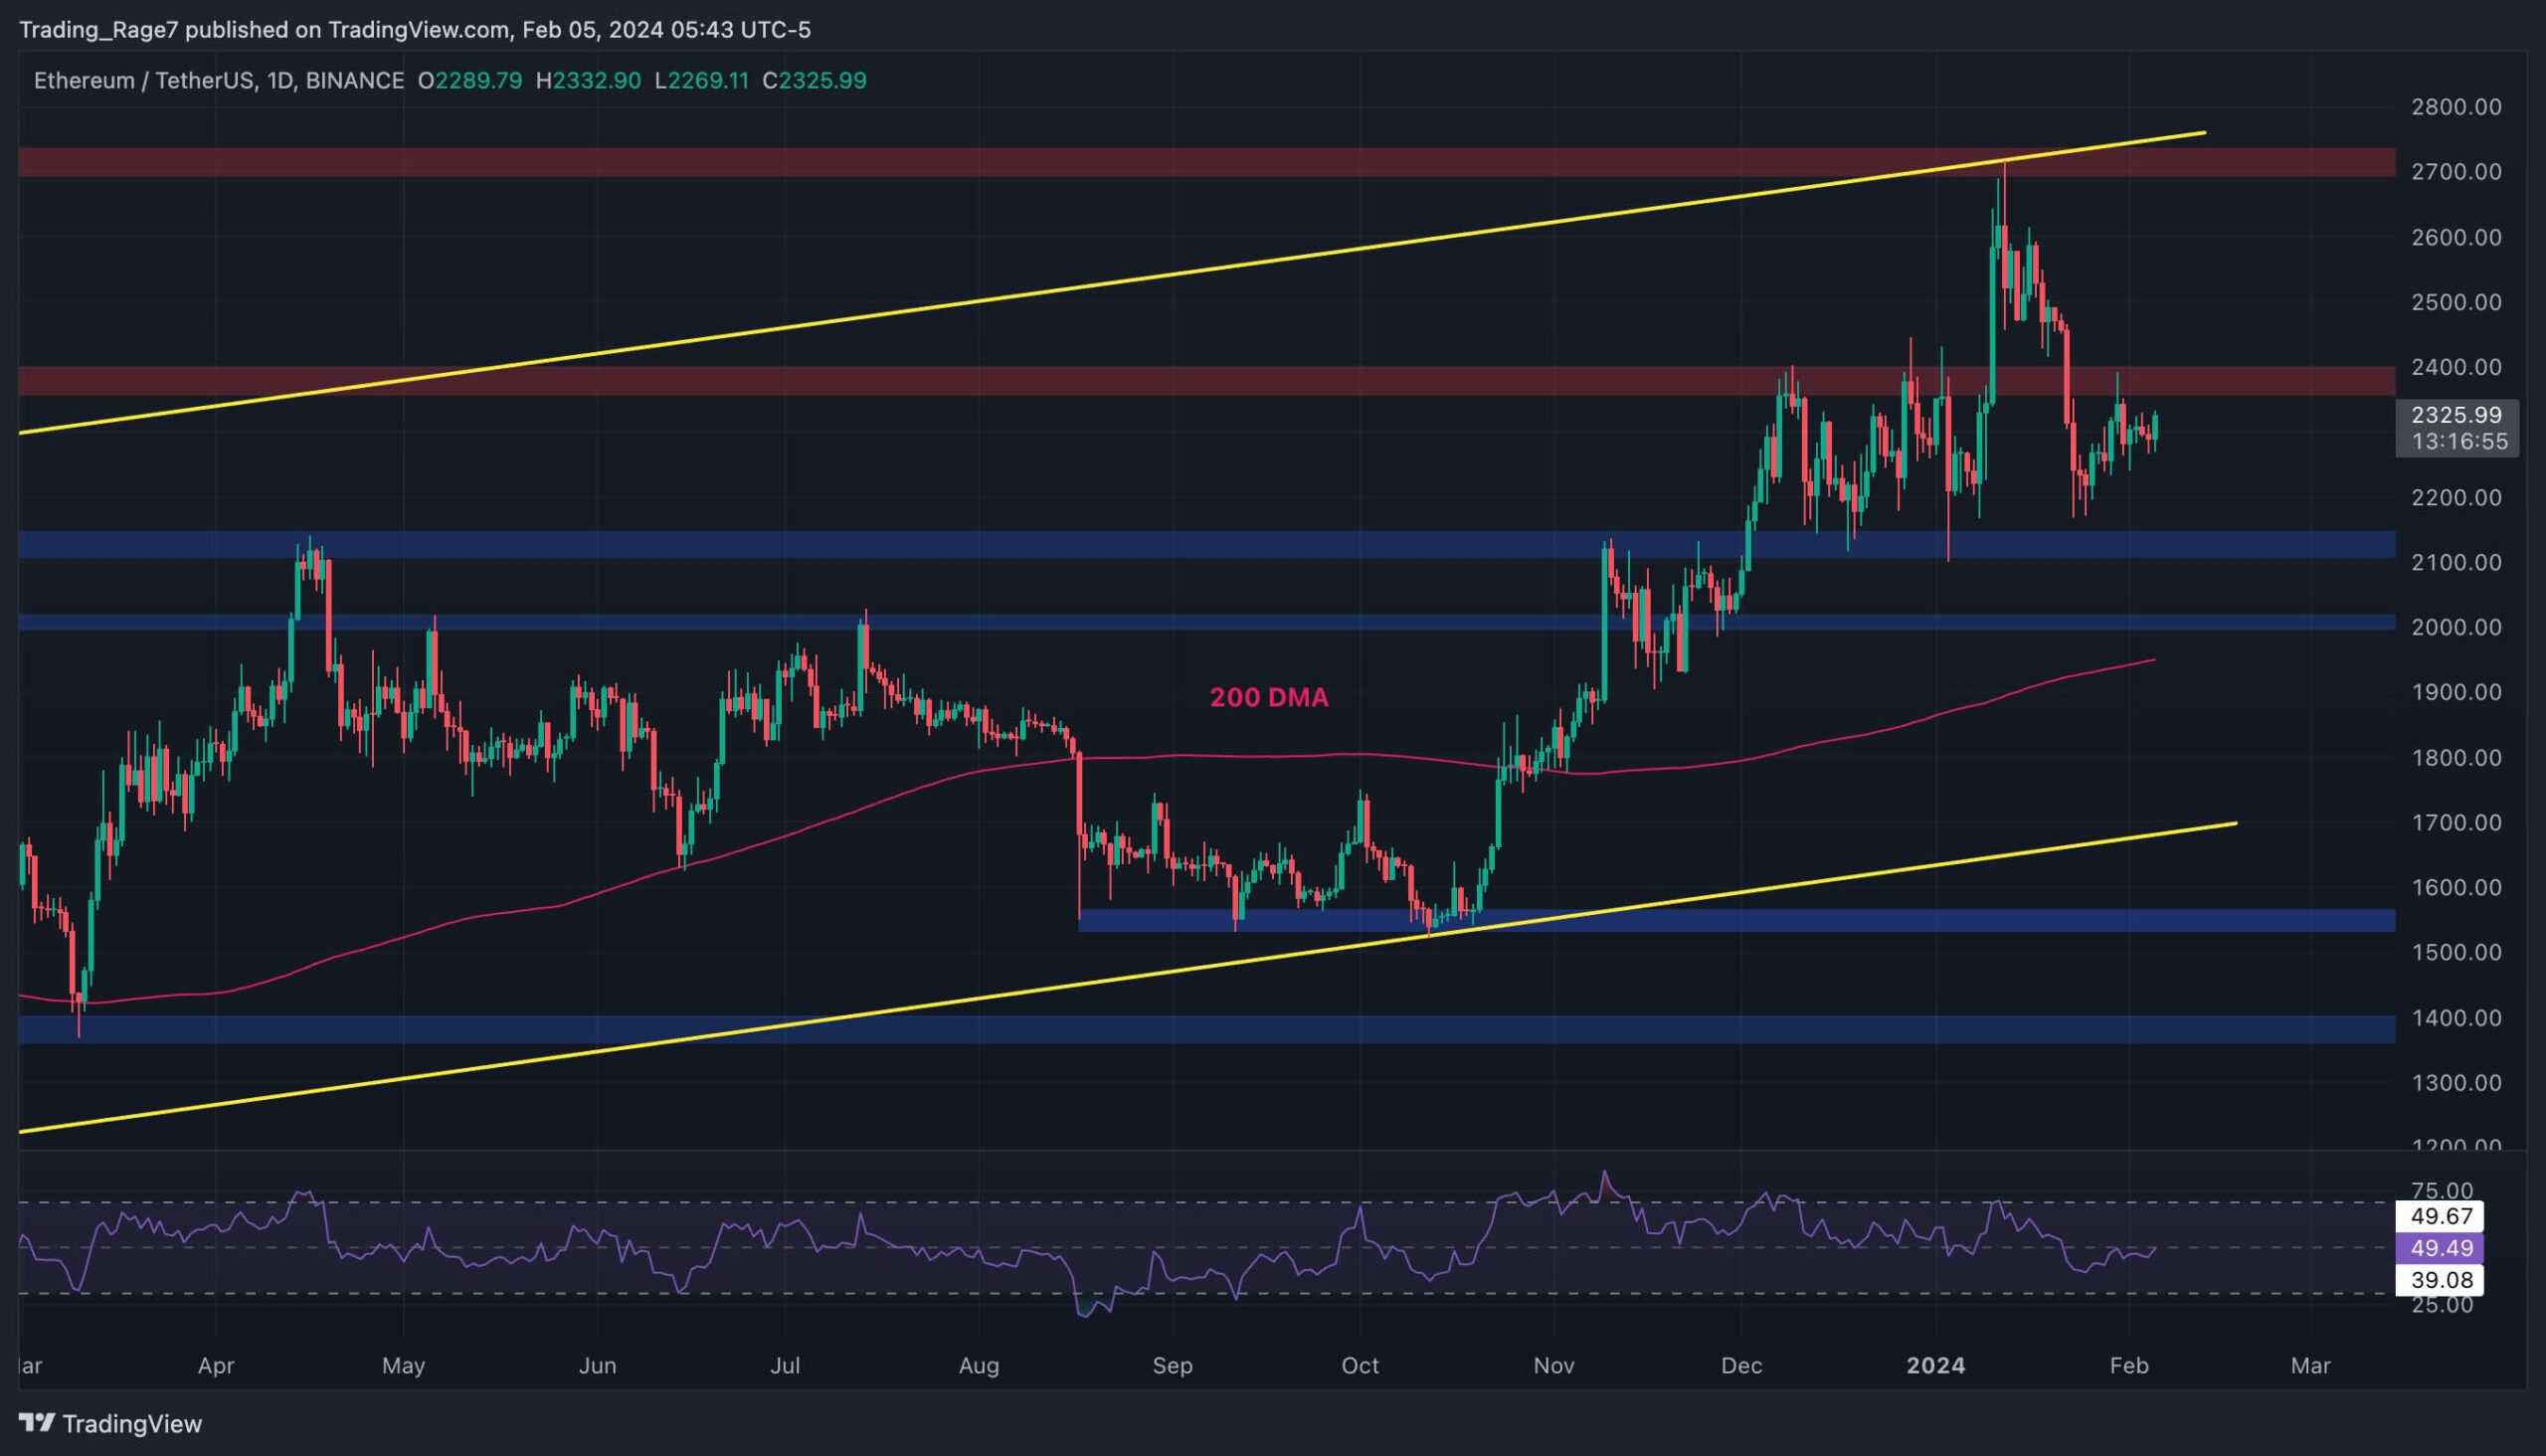
The Daily Chart
On the daily timeframe, the price has been rejected from $2,700 and the higher boundary of the large ascending channel. The $2,400 level has also been broken down, and the price is currently retesting from below.
In case ETH climbs back above $2.4K, a rally toward the $2,700 level and potentially higher could be expected.
On the other hand, a rejection from the mentioned level would likely result in a drop toward the 200-day moving average, located around the $2,000 mark.
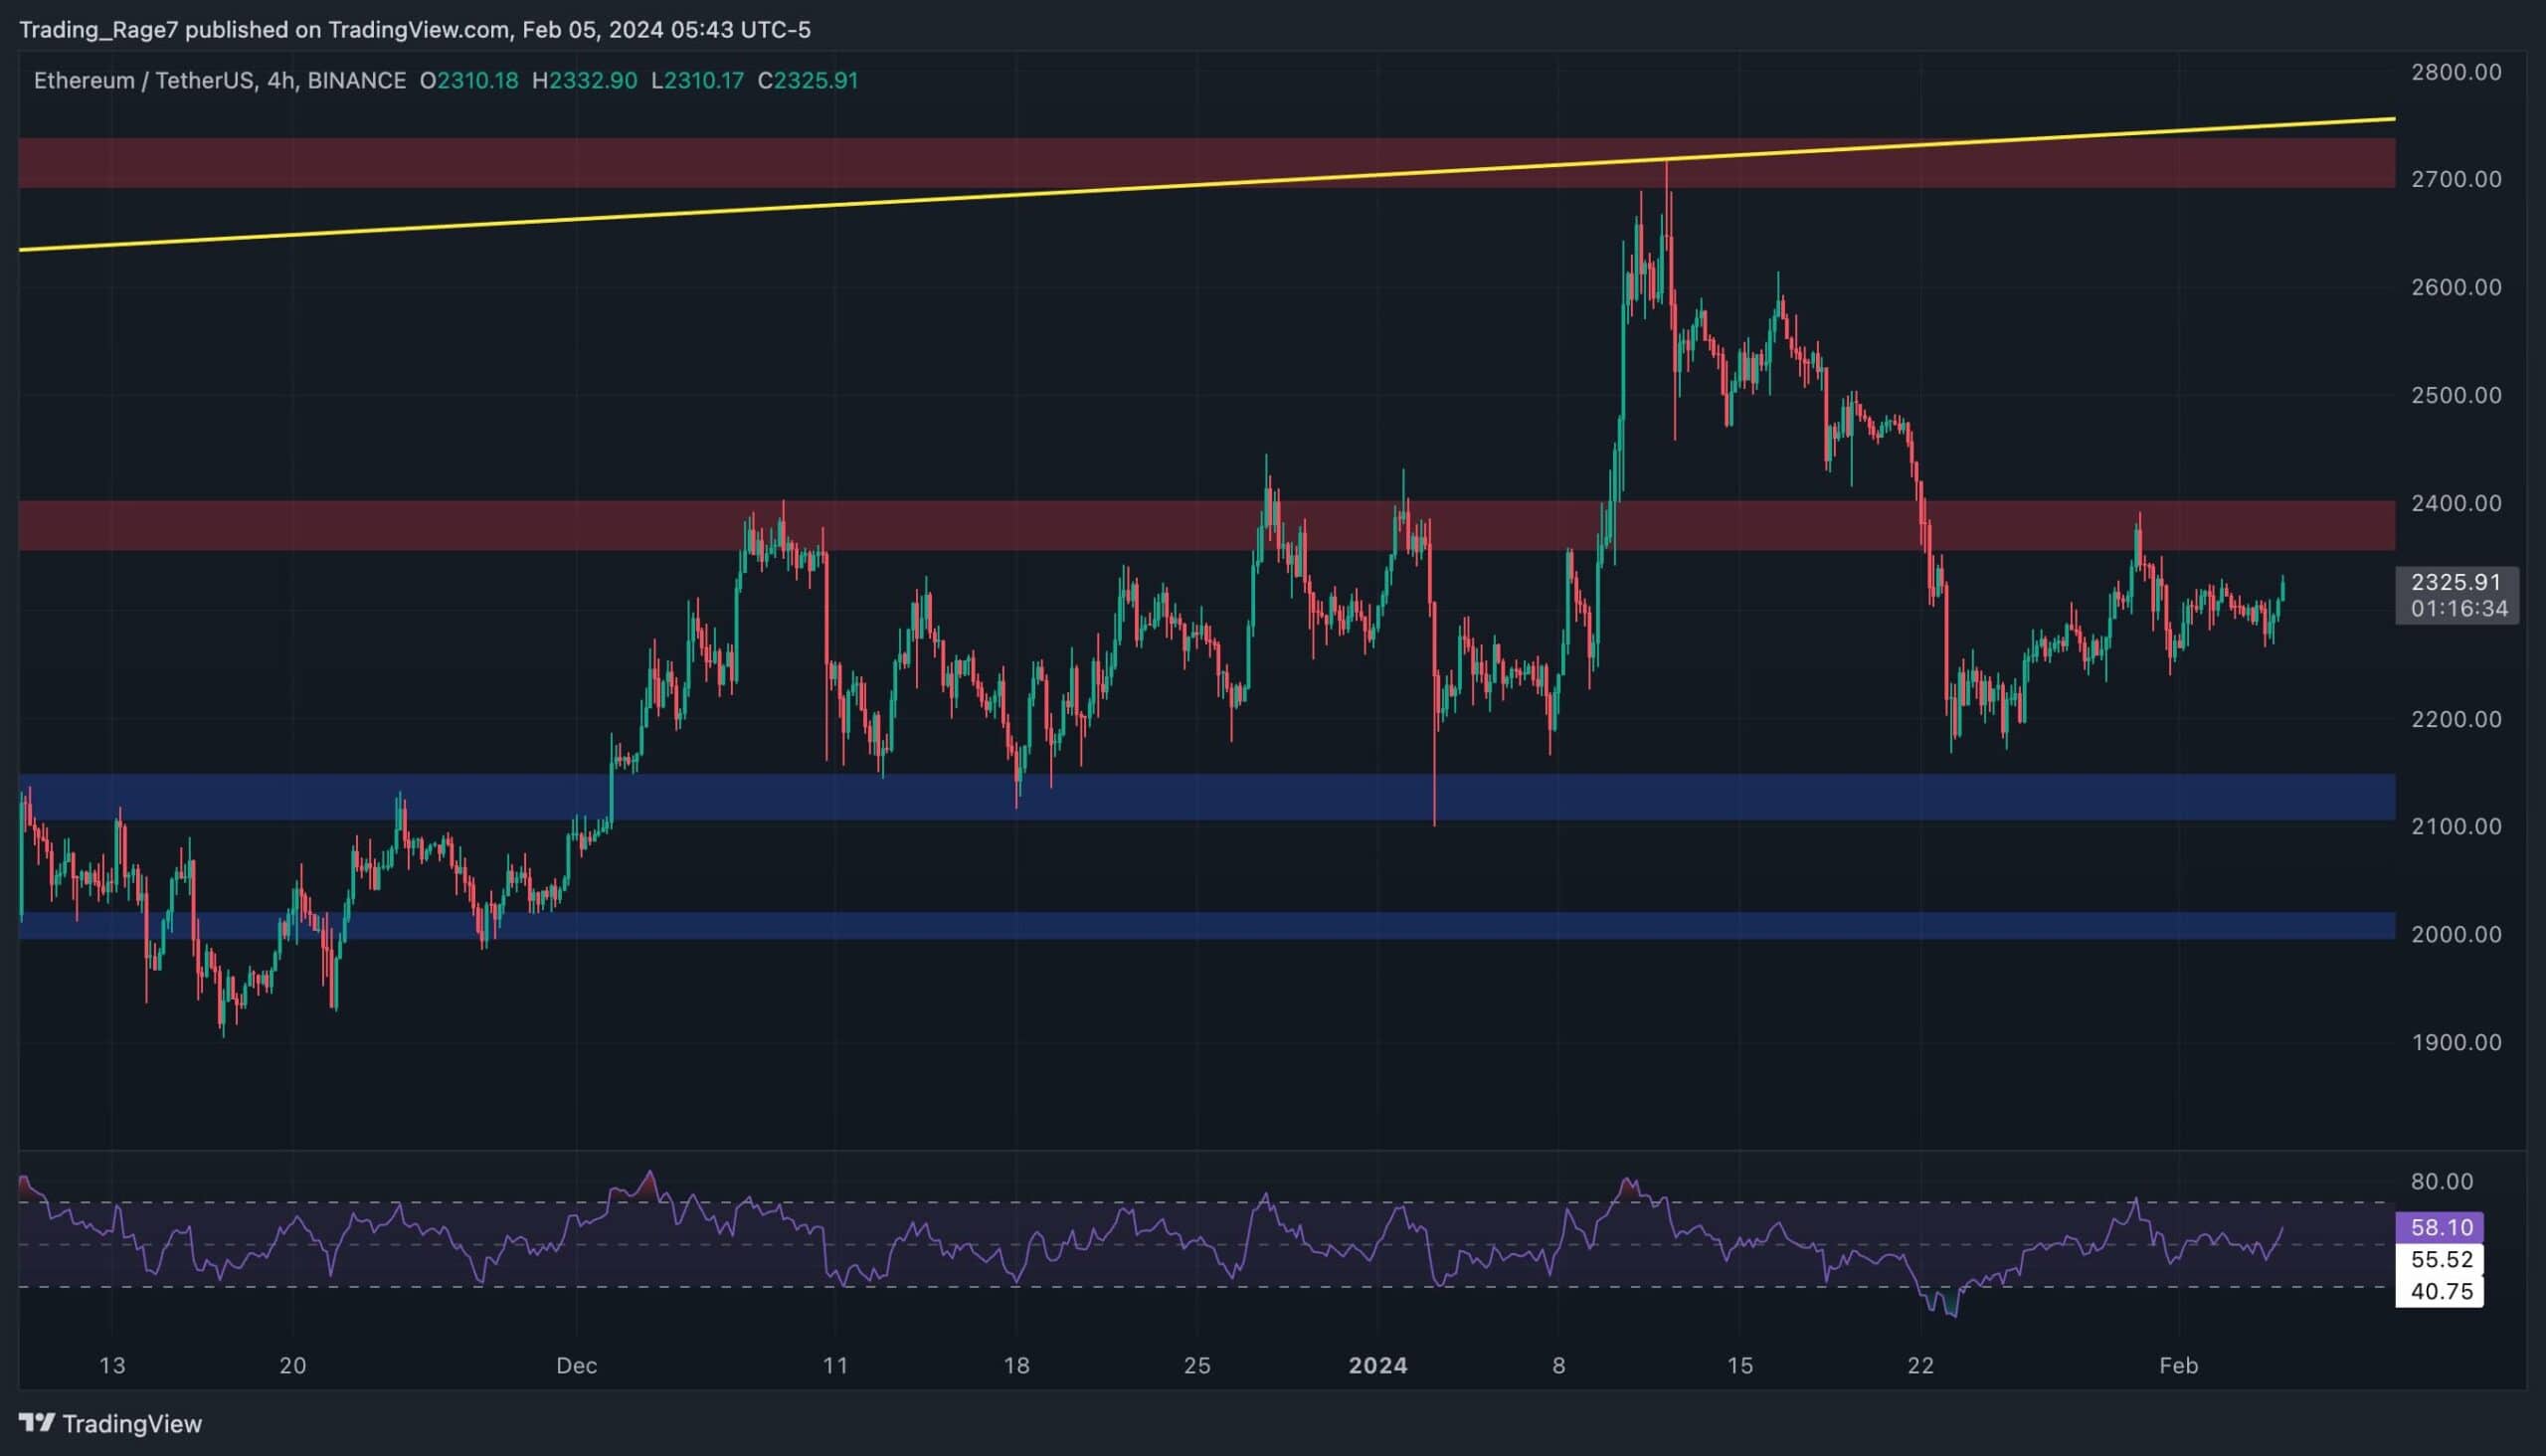
The 4-Hour Chart
Looking at the 4-hour chart, the price has been gradually working its way up toward the $2,400 level. While it has already been rejected once, ETH is once again approaching the level.
The Relative Strength Index is also showing values above 50%, indicating that the momentum is in favor of the buyers. Therefore, a breakout above the $2,400 resistance zone seems more likely at the moment.
Sentiment Analysis
By TradingRage
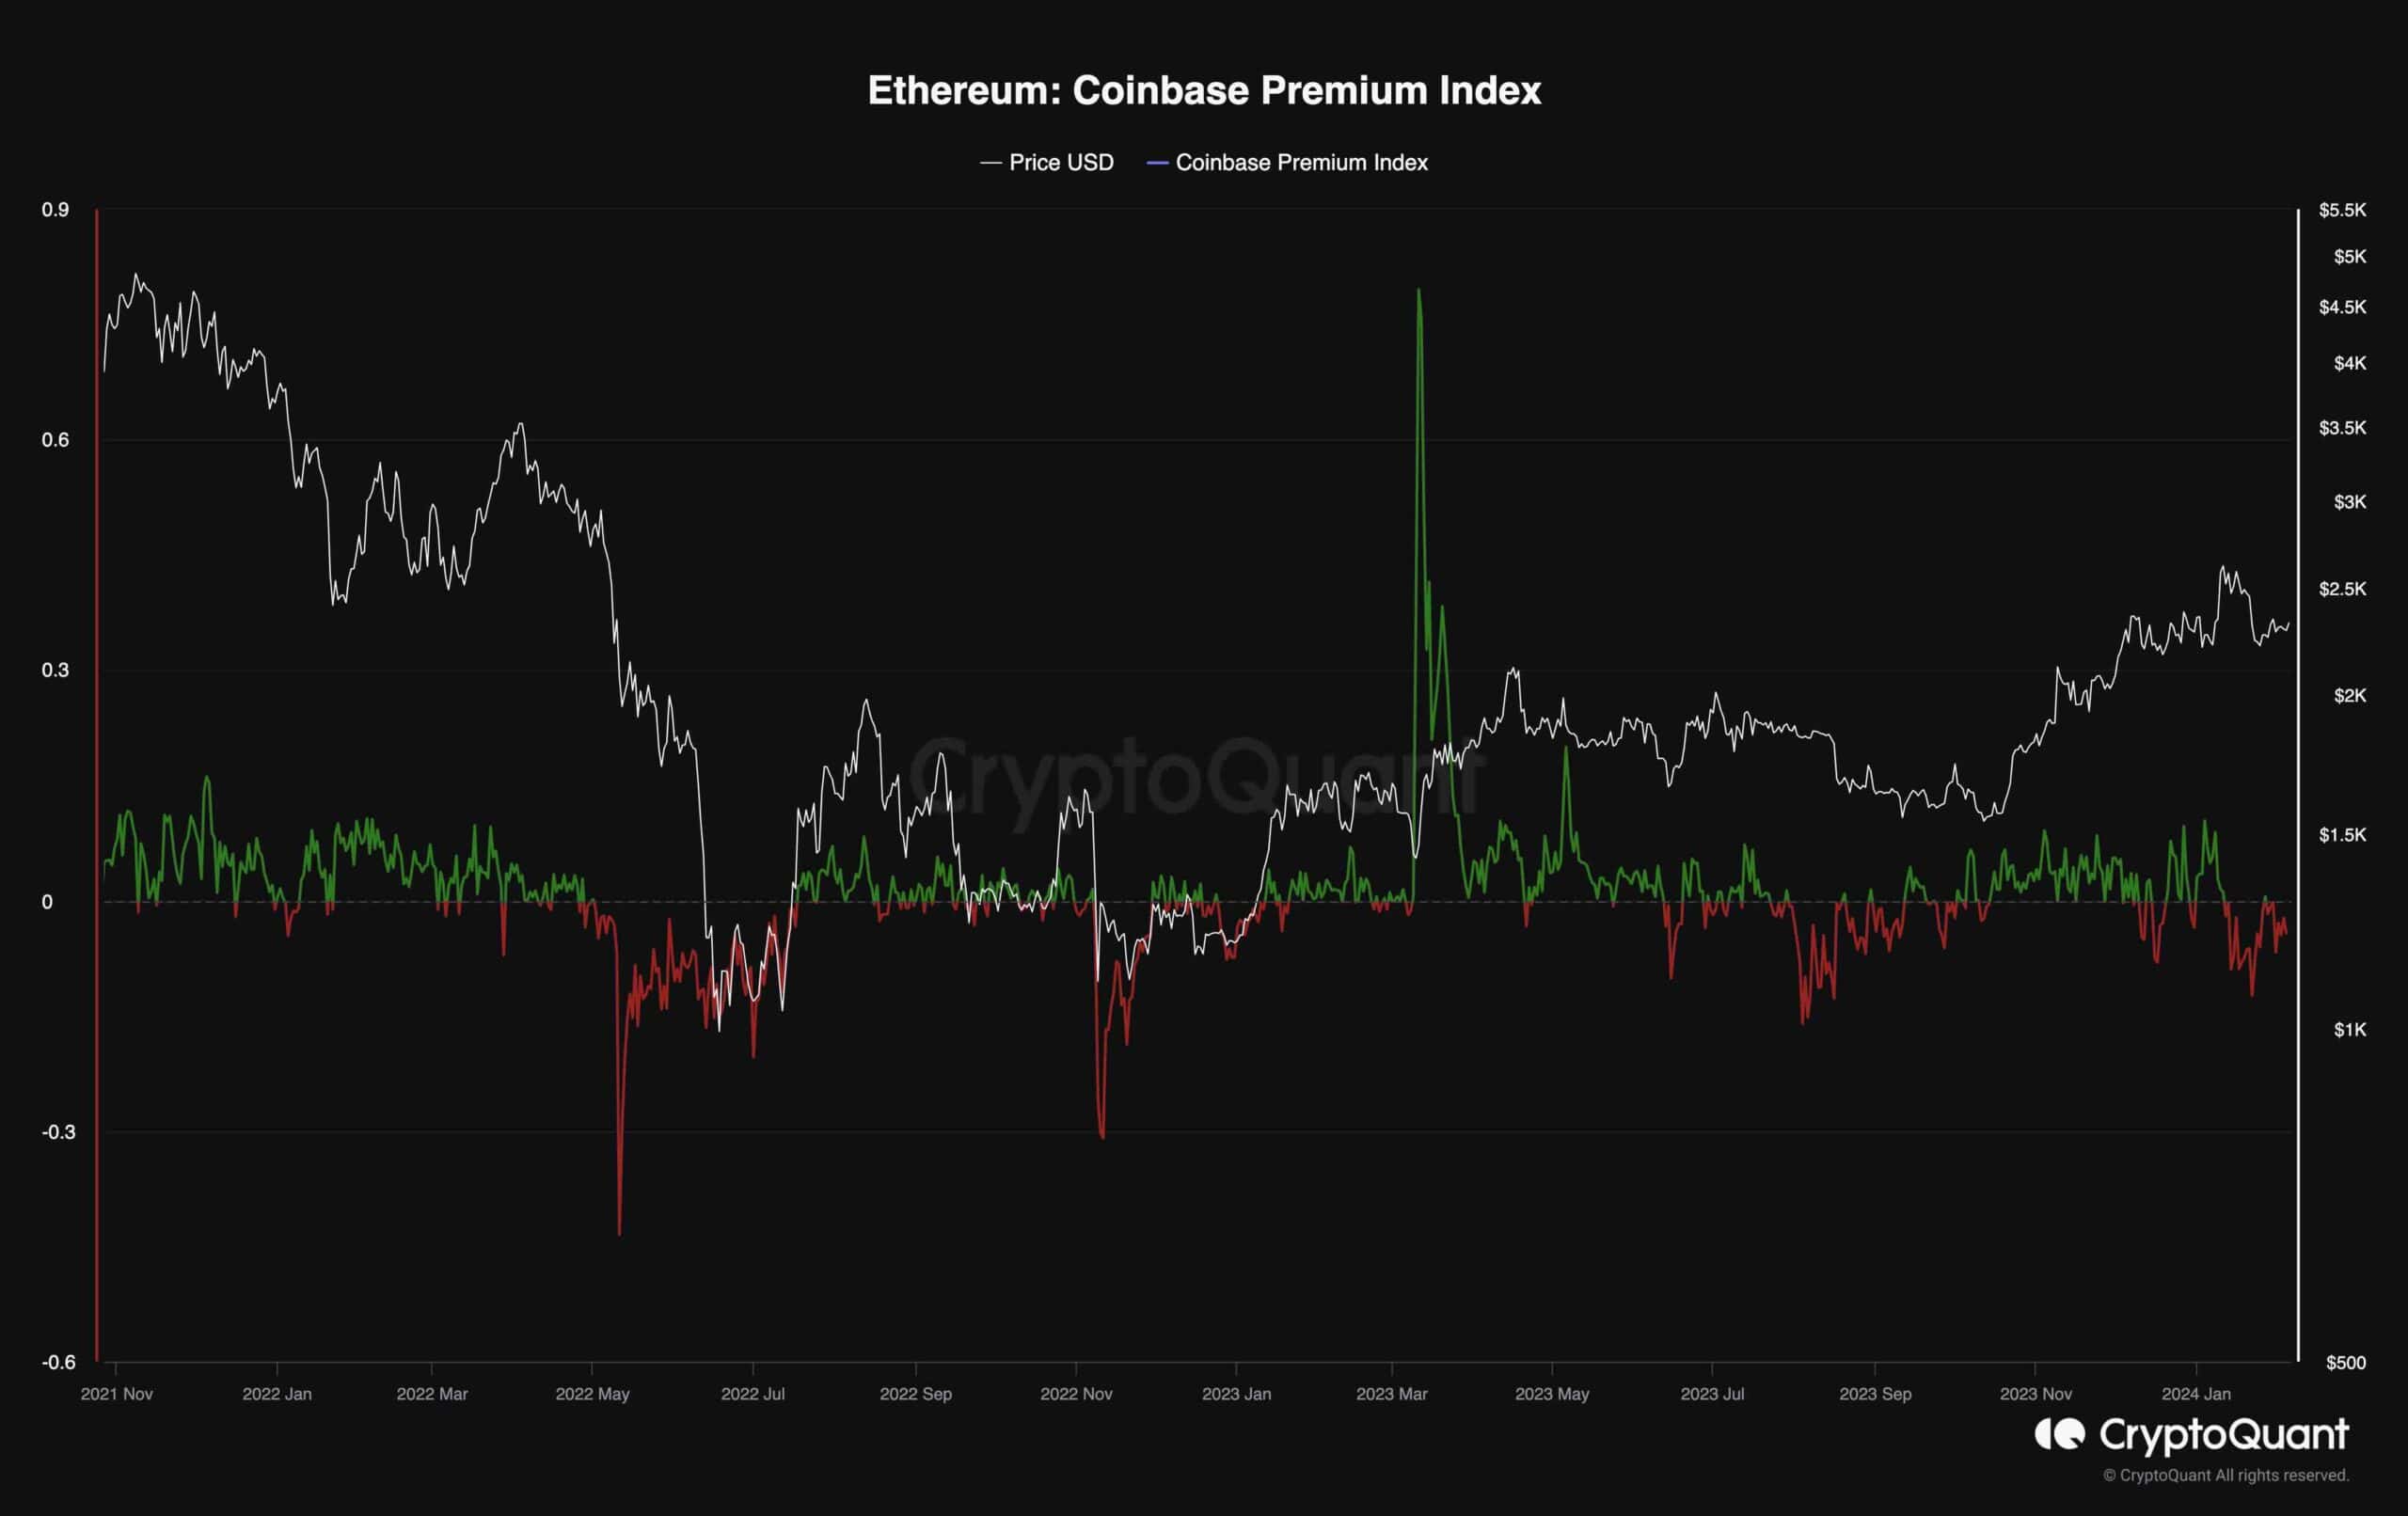
Ethereum Coinbase Premium Index
Ethereum’s price has been consolidating above the $2,000 level, failing to continue its upward momentum. Meanwhile, it would be beneficial to evaluate market sentiment in order to anticipate the potential direction of future price action.
This chart presents the Ethereum Coinbase premium index. This metric visualizes whether traders and investors on Coinbase are buying or selling ETH relative to other exchanges. Positive values indicate buying pressure on Coinbase, while negative values show aggregate supply.
As Coinbase is Americans’ go-to crypto exchange, it provides a suitable sample for analyzing their sentiment. As the chart suggests, the index has been showing negative values recently.
This points to the fact that American investors are bearish on aggregate, as they are selling their holdings. As they are an influential cohort with significant financial resources, their selling pressure might be the reason for the recent price decline and could lead to a further drop in ETH’s price if not met with sufficient demand.
Binance Free $100 (Exclusive): Use this link to register and receive $100 free and 10% off fees on Binance Futures first month (terms).
Disclaimer: Information found on CryptoPotato is those of writers quoted. It does not represent the opinions of CryptoPotato on whether to buy, sell, or hold any investments. You are advised to conduct your own research before making any investment decisions. Use provided information at your own risk. See Disclaimer for more information.
Cryptocurrency charts by TradingView.